USDCHF: Buy @ 0.9960
USDCHF: 1.0011
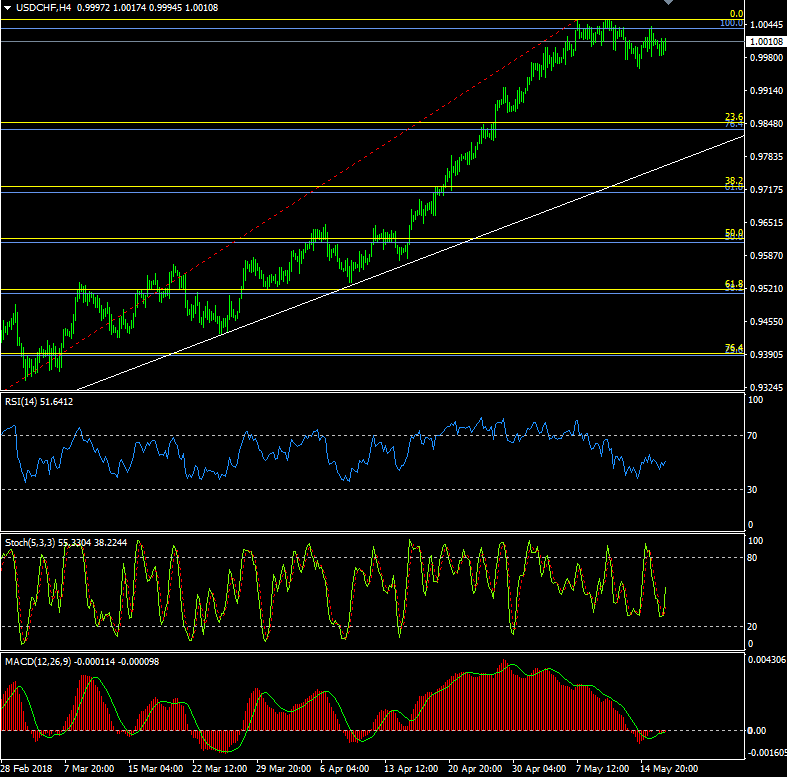
US$Chf was choppy on Wednesday, trading a range of 0.9983/1.0018, and currently unchanged from this time yesterday at 1.0010, further choppy sideways trade looks possible.
1 hour/4 hour indicators: Neutral.
Daily Indicators: Possible topping formation.
Weekly Indicators: Up
Preferred Strategy: The short term momentum indicators look neutral again today, while the dailies still look a little toppish and it maybe that the recent uptrend has now run its course, possibly with some choppy trade ahead, allowing the charts to unwind. The weekly charts still point higher though, so looking to buy dips remains the medium/longer term strategy.
If the dollar heads lower, support will again be seen at 0.9975/85, ahead of 0.9955/60 and minor levels at 0.9935/15 ahead of the 1 May low of 0.9890. This looks unlikely right now but if wrong, on a break of 0.9890, further bids should arrive at 0.9870 and at 0.9845/50.
On the topside, above Tuesday’s 1.0020, decent resistance will be seen at the trend high of 1.0055, which looks unlikely to be taken out today, but above which would open the way to 1.0065/70, which is a major Fibo level, and to 1.0100. Further out we are potentially looking at a run up to 1.0170 and even to the December 2016 high of 1.0343 albeit probably not for a while to come.
Buy US$Chf @ 0.9960. SL @ 0.9930, TP @ 1.0100
| Resistance | Support | ||
| 1.0107 | Apt 2017 high | 1.0000 | Pivot |
| 1.0099 | May 2017 high | 0.9983 | 15 May low /Session low |
| 1.0067 | (76.4% of 1.0343/0.9187) | 0.9957 | 14 May low |
| 1.0055/56 | 7 May high /9 May high /11 May high | 0.9935 | 2 May low |
| 1.0041 | 15 May high | 0.9890 | 1 May low |
Author

Jim Langlands
FX Charts
Jim Langlands began his trading career in the commodities markets in London in 1976, before moving to Australia in 1979 to work as a floor trader on the Sydney Futures Exchange.


