USDCHF: Buy @ 0.9740

USDCHF: 0.9781
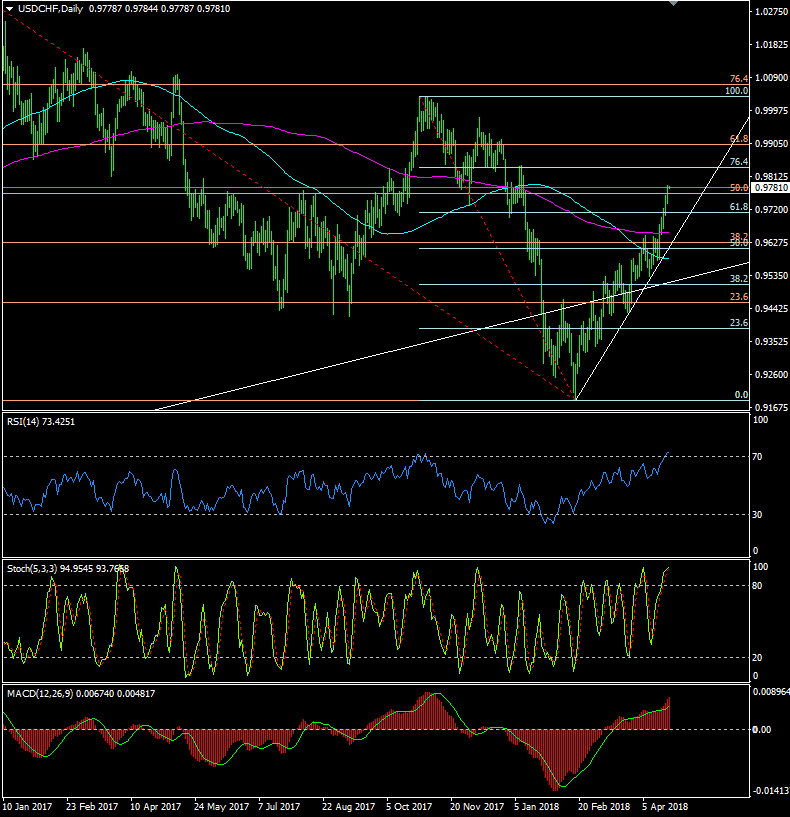
US$Chf had another squeeze higher on Monday as it moved up from 0.9750 to 0.9787, closing at the highs.
1 hour/4 hour indicators: Turning higher
Daily Indicators: Turning higher
Weekly Indicators: Turning higher
Preferred Strategy: The short term momentum indicators still look positive for further gains, although the hourlies appear to show some minor bearish divergence, but there is no change to the view of trading from the long side. Minor support will arrive at 0.9750 and at 0.9735 ahead of Friday’s low of 0.9705 and buying dips is preferred. Further out, if the dollar falls back below the 0.9690 (200 WMA/Weekly cloud base), we could then see a return to the 200 DMA/18 Apr low at 0.9655/50, below which stops would be triggered and we could see a return to 0.9625, although that currently looks unlikely. As long as we remain above the rising trend support I prefer to buy the dips although the recent acceleration higher has now seen the pair move away from the trendline which currently lies some way off, at 0.9625.
On the topside, the longer term momentum indicators are now picking up a bit of speed and beyond 0.9785/90 could see a run towards 0.9805/15 and then on to 0.9835 although possibly not today. If wrong, further gains could open the way to 0.9900 and then to 0.9975/1.0000.
Buy US$Chf @ 0.9740. SL @ 0.9785, TP @ 0.9835
| Resistance | Support | ||
| 0.9845 | 10 Jan high | 0.9750 | Minor |
| 0.9835 | (76.4% of 1.0038/0.9187) | 0.9736 | Session low |
| 0.9815 | 11 Jan high | 0.9705 | Friday low |
| 0.9800 | Minor | 0.9690 | 200 WMA/Weekly cloud base |
| 0.9787 | Session high/100 WMA | 0.9665 | 19 April low |
Economic data highlights will include:
Trade Balance
Author

Jim Langlands
FX Charts
Jim Langlands began his trading career in the commodities markets in London in 1976, before moving to Australia in 1979 to work as a floor trader on the Sydney Futures Exchange.


