USDCHF: Buy @ 0.9695

USDCHF: 0.9714
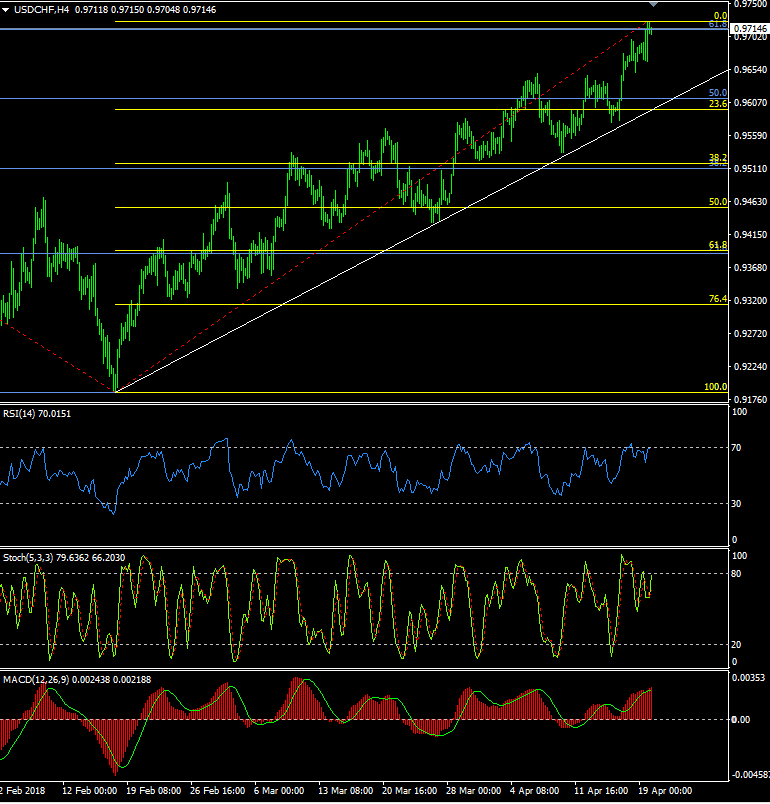
US$Chf had another squeeze higher on Thursday; care of a further rally in EurChf, which is finally hit 1.2000 (today moving from 1.1957 to 1.2001). US$Chf moved up from 0.9666 to 0.9723 before closing at 0.9715.
1 hour/4 hour indicators: Turning higher
Daily Indicators: Turning higher
Weekly Indicators: Turning higher
Preferred Strategy: The short term momentum indicators still look positive for further gains and there is no change to the view of trading from the long side, and as long as we remain above the rising trend support I prefer to buy the dips.
The longer term momentum indicators look as though they may be picking up a bit of speed, and having broken above the 200 WMA/Weekly cloud base (0.9690/95) we could now be in for a move towards 0.9765 although we do need to close the week above 0.9695 to add confidence to this view.
If the dollar falls back below the 0.9690 we could then see a return to the 200 DMA/18 Apr low at 0.9655/50, below which stops would be triggered and we could see a return to 0.9600, although that currently looks unlikely.
Buy US$Chf @ 0.9695. SL @ 0.9645, TP @ 0.9765
| Resistance | Support | ||
| 0.9800 | Minor | 0.9690 | 200 WMA/Weekly cloud base |
| 0.9765 | (50% pivot of 1.0343/0.6187) | 0.9666 | Session low |
| 0.9740 | Minor | 0.9655/50 | 200 DMA /18 Apr low |
| 0.9723 | Session high | 0.9590 | (23.6% of 0.9187/0.9723/ Rising trend support |
| 0.9710 | (61.8% of 1.0037/0.9187) | 0.9585 | 100 DMA |
Author

Jim Langlands
FX Charts
Jim Langlands began his trading career in the commodities markets in London in 1976, before moving to Australia in 1979 to work as a floor trader on the Sydney Futures Exchange.


