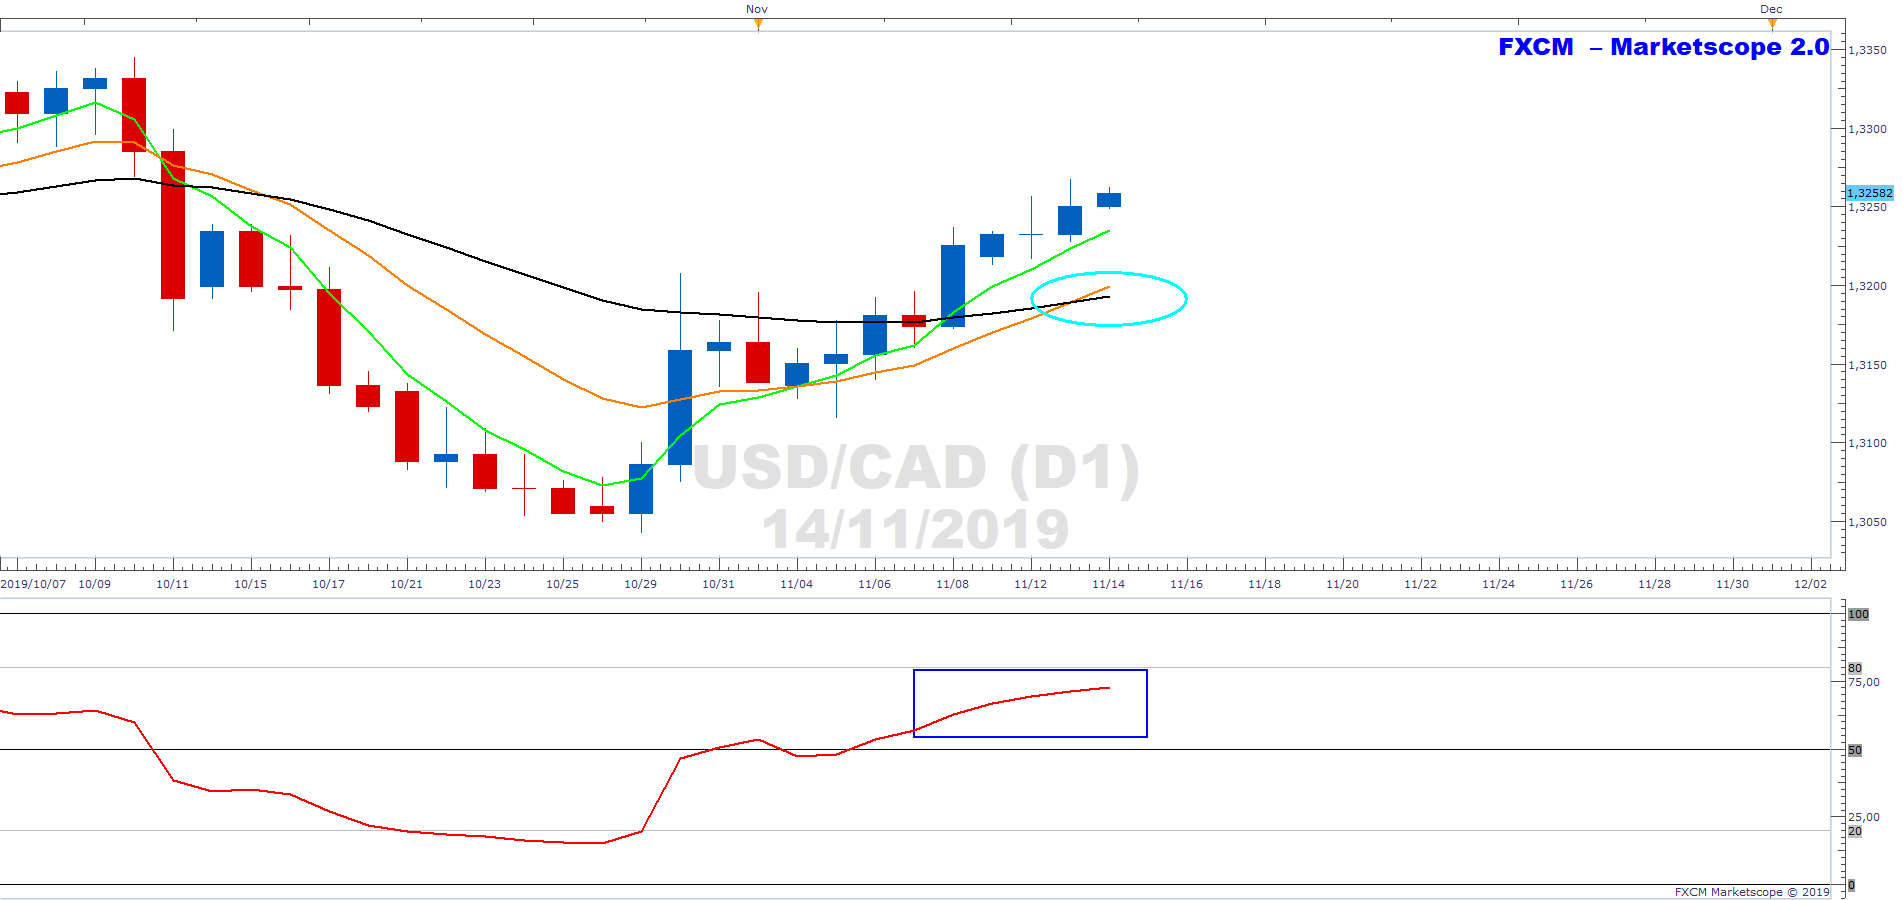
USD/CAD's EMAs Move into Bullish Stack on Daily

The below is the daily chart of the USDCAD. The orange 13-day EMA has crossed above the black 34-day EMA (aqua ellipse). This cross has but the EMAs into bullish stack i.e. the green 5-day EMA is above the orange 13-day EMA, and the orange 13-day EMA is above the black 34-day EMA. Moreover, we note that the RSI is above 50 (blue rectangle), confirming the underlying bullish momentum. If the EMAs develop further angle and separation and maintain their pattern it will likely signal an increase in the upside momentum. We continue to monitor.
Past performance is not an indicator of future results.
CHART SOURCE: FXCM MARKETSCOPE 2.0
Author

Russell Shor (MSTA, CFTe, MFTA) has an Honours Degree in Economics from the University of South Africa and holds the coveted Certified Financial Technician and Master of Financial Technical Analysis qualifications from the Interna


