USD/CAD stops near 200-SMA: Temporary pause or bullish setup? [Video]
![USD/CAD stops near 200-SMA: Temporary pause or bullish setup? [Video]](https://editorial.fxstreet.com/images/Markets/Currencies/Majors/USDCAD/hundred-dollar-bills-canadian-3057589_XtraLarge.jpg)
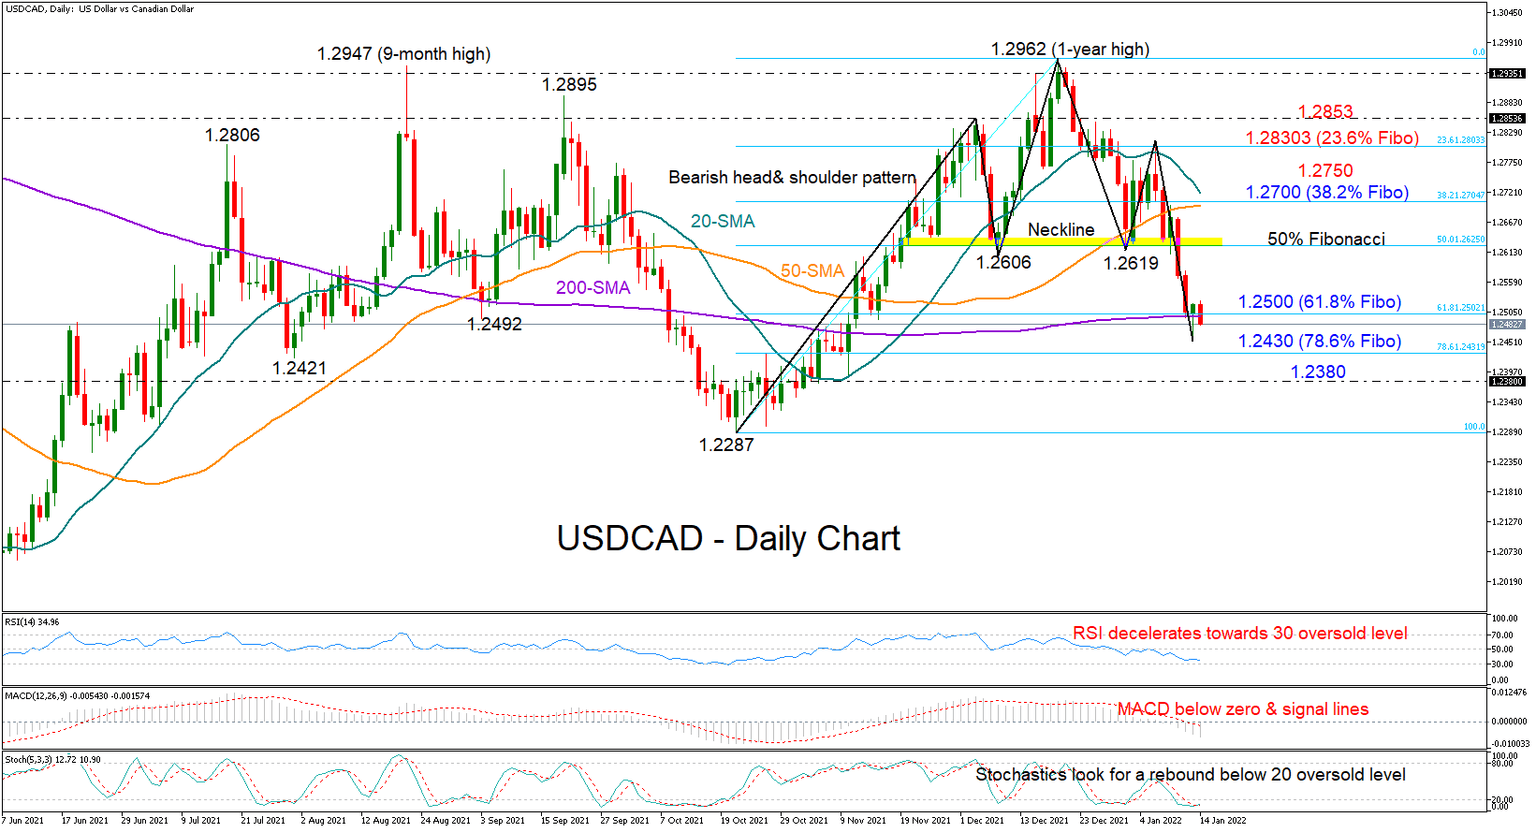
USDCAD slumped towards the 200-day simple moving average (SMA) at 1.2495 after its bullish efforts to cross above the 50-day SMA and enter the 1.2700 territory collapsed, with the pair set to close 1.40% lower this week.
Thursday’s session seems to have formed a bullish hammer candlestick in the chart, which foresees a reversal in price direction, though additional green candlesticks will be needed to confirm that. The Stochastics are also increasing the stakes for an upturn in the coming sessions as the indicator seems to have found a bottom below its 20 oversold level.
Yet, given the persisting negative momentum in the RSI and the MACD, and the fact that the pair has already breached the neckline of a bearish head and shoulder trend pattern, traders may cautiously monitor any upside corrections.
For now, the 61.8% Fibonacci retracement of the 1.2287 – 1.2962 up leg at 1.2500 is guarding the floor around the 200-day SMA, and should the bears violate that bar, selling forces could intensify, turning the spotlight straight to the 78.6% Fibonacci of 1.2430. Steeper declines could drive the price towards the 1.2287 low, unless the 1.2380 handle comes to the rescue.
Alternatively, an improvement in sentiment could lift the pair up to the 50% Fibonacci of 1.2625, but a break above the 1.2700 restrictive area, where the 20- and 50-day SMAs are currently converging, could be a bigger achievement. The 38.2% Fibonacci is also located in the same position. If the bulls knock down that wall, resistance could next emerge somewhere between the 23.6% Fibonacci of 1.2830 and the 1.2850 barrier.
Summarizing, although the latest downfall in USDCAD is showing some signs of exhaustion, the bulls will need to stage a clear bounce around the 1.2500 level to get the upper hand.
Author

Christina joined the XM investment research department in May 2017. She holds a master degree in Economics and Business from the Erasmus University Rotterdam with a specialization in International economics.


