USD/CAD plummets but 200-day SMA caps downside, GBP/JPY battling to keep its feet above trendline

USD/CAD plummets but 200-day SMA caps downside
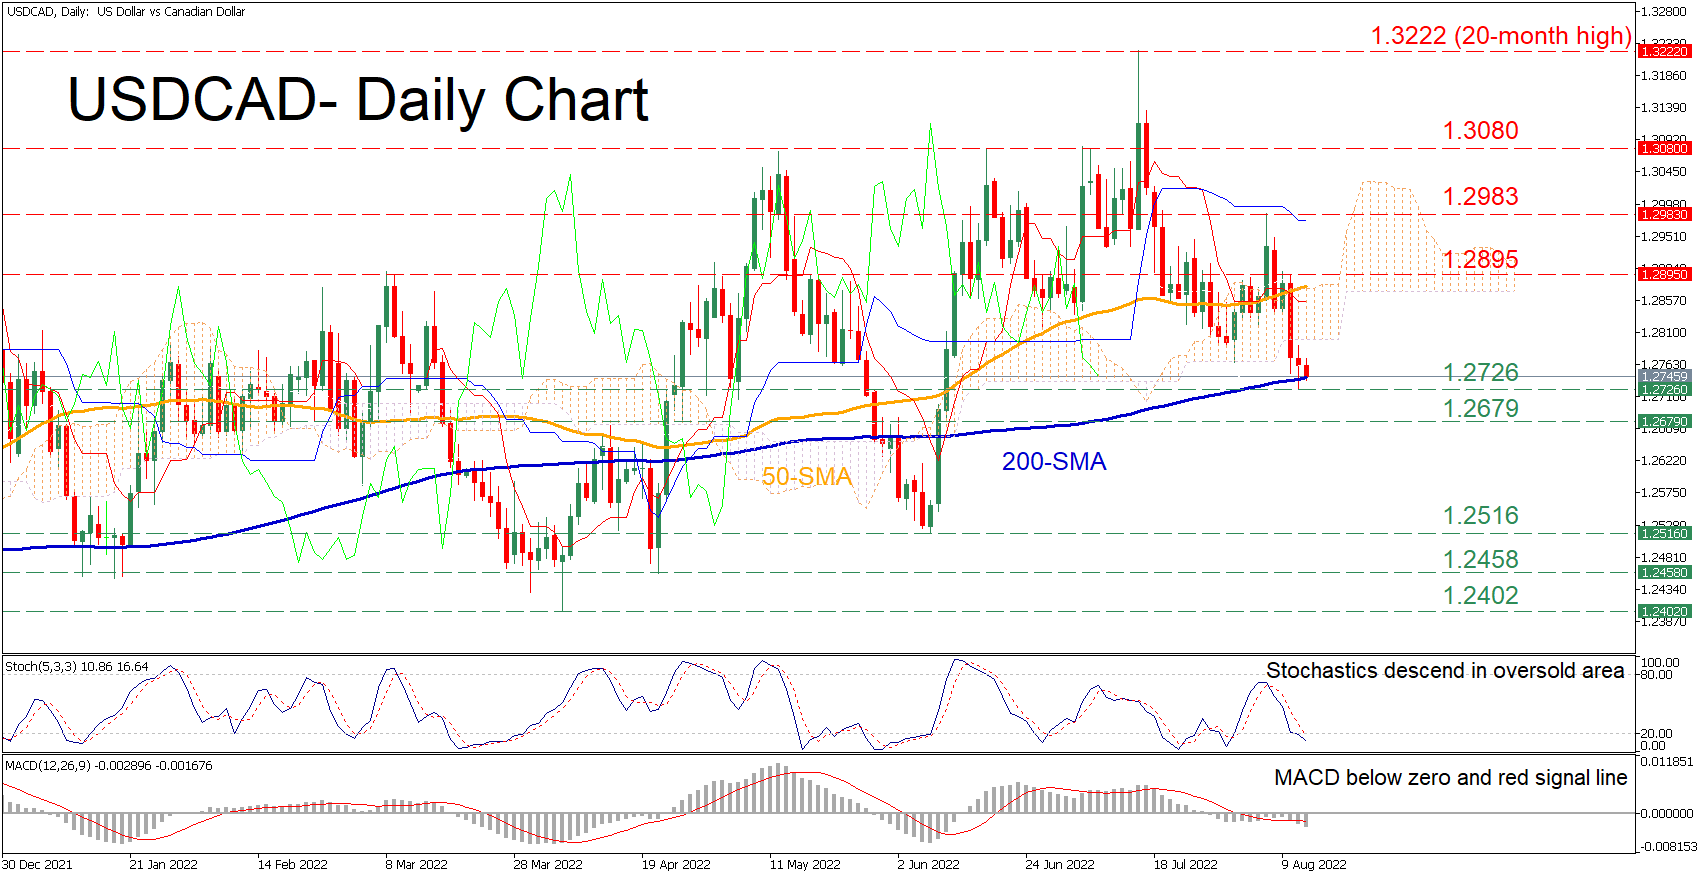
USDCAD has been losing ground in the short term since it peaked at the 20-month high of 1.3222 in mid-July. Moreover, in the last few sessions, the technical picture has deteriorated further, with the price crossing below both its 50-day simple moving average (SMA) and the Ichimoku cloud.
The momentum indicators are reflecting that the latest downside move could resume as near-term risks are tilted to the downside. Specifically, the stochastic oscillator is sloping downwards in the 20-oversold zone, while the MACD histogram is currently beneath both zero and its red signal line.
To the downside, should the price dive below crucial 200-day SMA, immediate support could be encountered at the recent low of 1.2726. Sliding beneath that floor, the 1.2679 barrier may come under examination before the pair challenges the June low of 1.2516. Any further price declines could then cease at the 1.2458 hurdle.
Alternatively, bullish actions might meet initial resistance at the 1.2895 region. Conquering this barricade, the bulls could aim for the recent peak of 1.2983. Failing to stop there, the price could ascend towards 1.3080 or higher to test the 20-month high of 1.3222.
In brief, even though USDCAD has been experiencing a sharp decline, the 200-day SMA appears to be acting as a strong floor. Hence, a violation of the latter could accelerate the downfall.
GBP/JPY battling to keep its feet above trendline
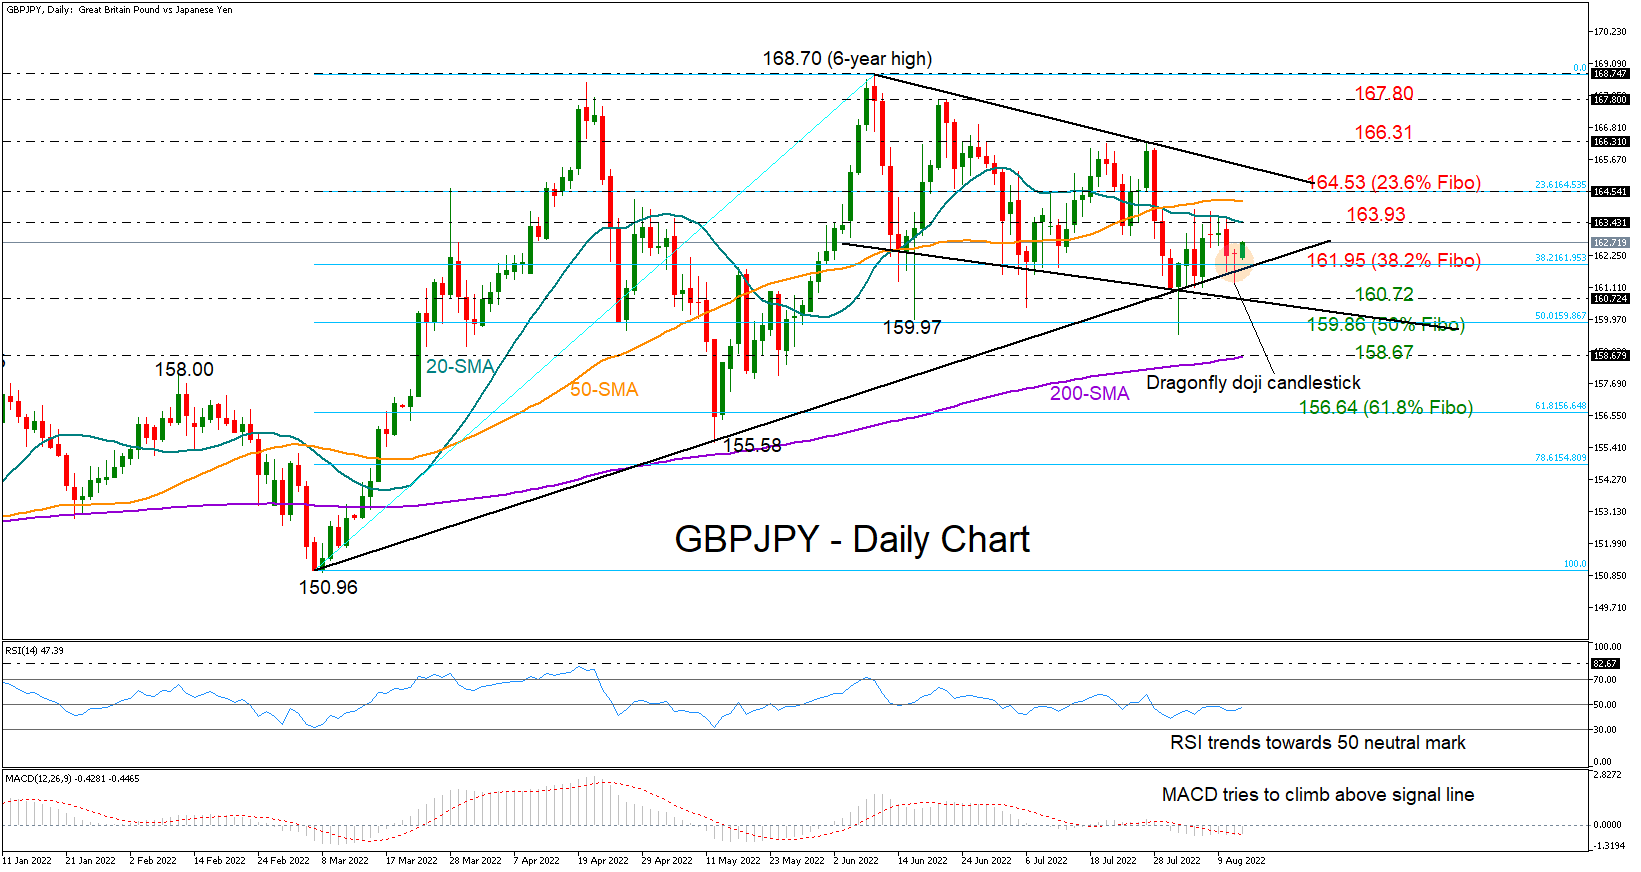
GBPJPY came under renewed selling pressure on Thursday but encouragingly it quickly managed to recover its flash drop to 161.26, closing neutral above the ascending trendline once again.
In addition to the above, Thursday’s candlestick reminds of a bullish dragonfly doji candlestick, which is a signal of a possible upside reversal, though whether the price will proceed higher on the following candlestick will confirm the appetite for more buying.
For now, the technical oscillators are displaying some improvement in market sentiment as the RSI keeps trending up, and the MACD is trying to climb above its red signal line in the negative area. Yet, as long as the former remains below 50, some caution is warranted.
If the price was to pick up steam, the 20-day simple moving average (SMA) could resume its resistance role at 163.43. If not, the next obstacle could pop up somewhere between the 50-day SMA and the 61.8% Fibonacci retracement of the 150.96 – 168.70 upleg at 164.53, while a decisive break above the descending trendline at 165.33 could be a bigger achievement. In the event the bulls climb that wall, traders will look for a close above the previous high of 166.31 to shift attention towards the April-June ceiling of 167.80 – 168.70.
On the downside, a durable move below the trendline and the 38.2% Fibonacci of 161.95 could initially push for a close below the support line seen at 160.72. Should the bears snap that bar, the spotlight will turn to the 50% Fibonacci of 159.86, while lower, the 200-day SMA at 158.67 could be the next target.
Summarizing, GBPJPY maintains some buying interest despite its recent consolidation. An extension above 163.43 could be the trigger for more upside.
Author

Stefanos joined XM as a Junior Investment Analyst in September 2021. He conducts daily market research on the currency, commodity and equity markets, from a fundamental and a technical perspective.


