USD/CAD holding steady, GBP/JPY tests support trendline [Video]
![USD/CAD holding steady, GBP/JPY tests support trendline [Video]](https://editorial.fxstreet.com/images/Markets/Currencies/Majors/USDCAD/one-hundred-canadian-dollar-bills-5599431_XtraLarge.jpg)
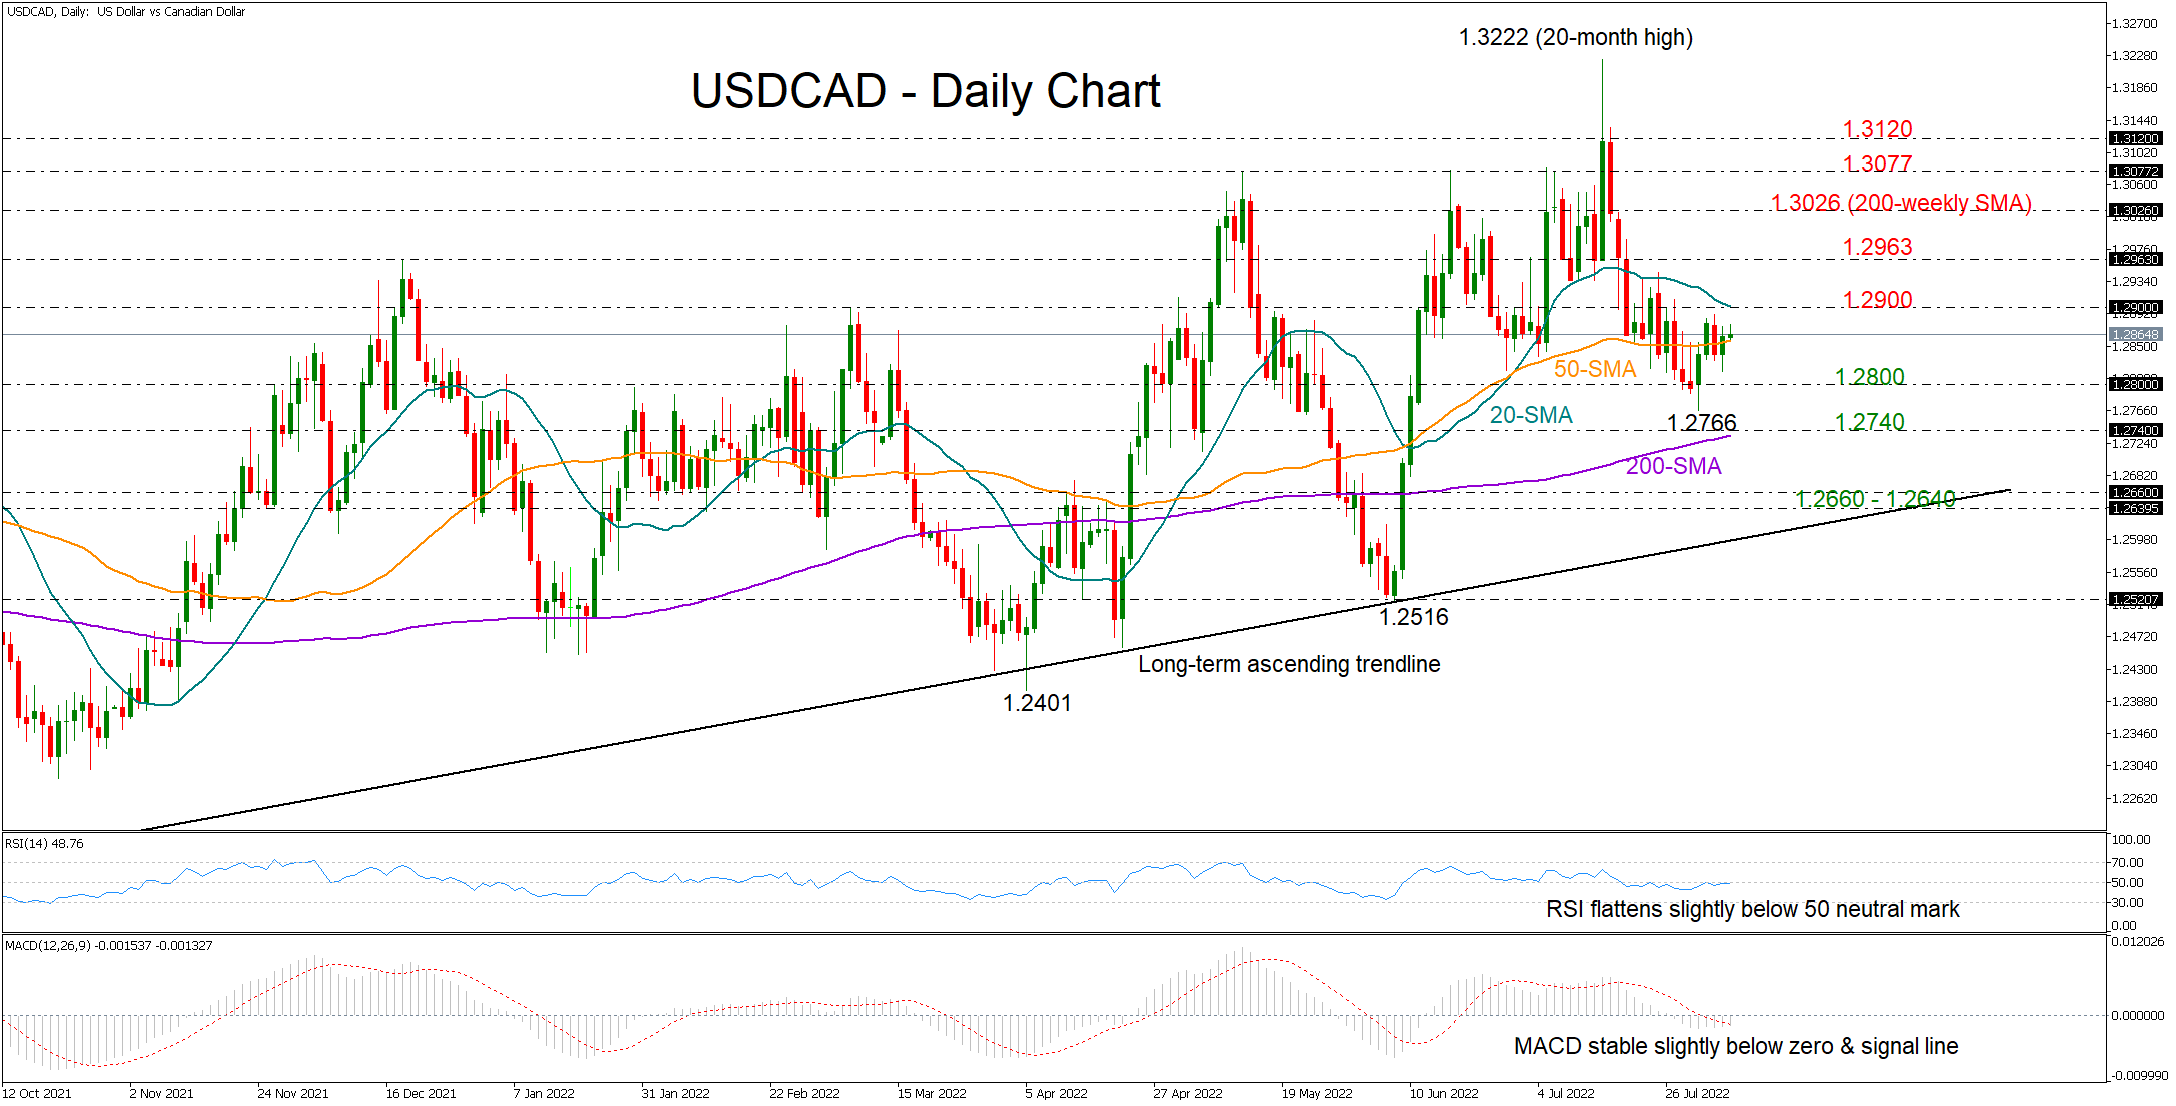
USD/CAD holding steady ahead of jobs data
USDCAD shifted to the sidelines immediately after charting a new lower low at 1.2766 in the short-term picture, unable to reach the constraining 20-day simple moving average (SMA).
The technical indicators state a bearish-to-neutral bias as the RSI keeps flattening marginally below its 50 neutral mark and the MACD is extending its short horizontal move slightly below zero around its red signal line.
Hence, traders may keep directing the market sideways unless they see a break above the 20-day SMA at 1.2900, and more importantly, a close above the 1.2963 restrictive zone. If that turns out to be the case, the bullish correction could ramp up to 1.3026, where the flattening 200-weekly SMA has been ceasing upside pressures over the past two months. Higher, a rally above the 1.3077 – 1.3120 resistance region could clear the way towards the 1.3222 top.
Should sellers retake control, initial limitations could occur around the 1.2800 level. A successful step lower may then halt around the 200-day SMA at 1.2740, a break of which could re-test the restrictions within the 1.2960 – 1.2940 zone before stretching towards the 2021 support trendline seen at 1.2612.
Summarizing, USDCAD is in a wait-and-see mode ahead of the US and Canadian jobs data due at 12:30 GMT. A close above 1.2900 or below 1.2800 could set the next tone in the market.
GBP/JPY tests support trendline, bias bearish
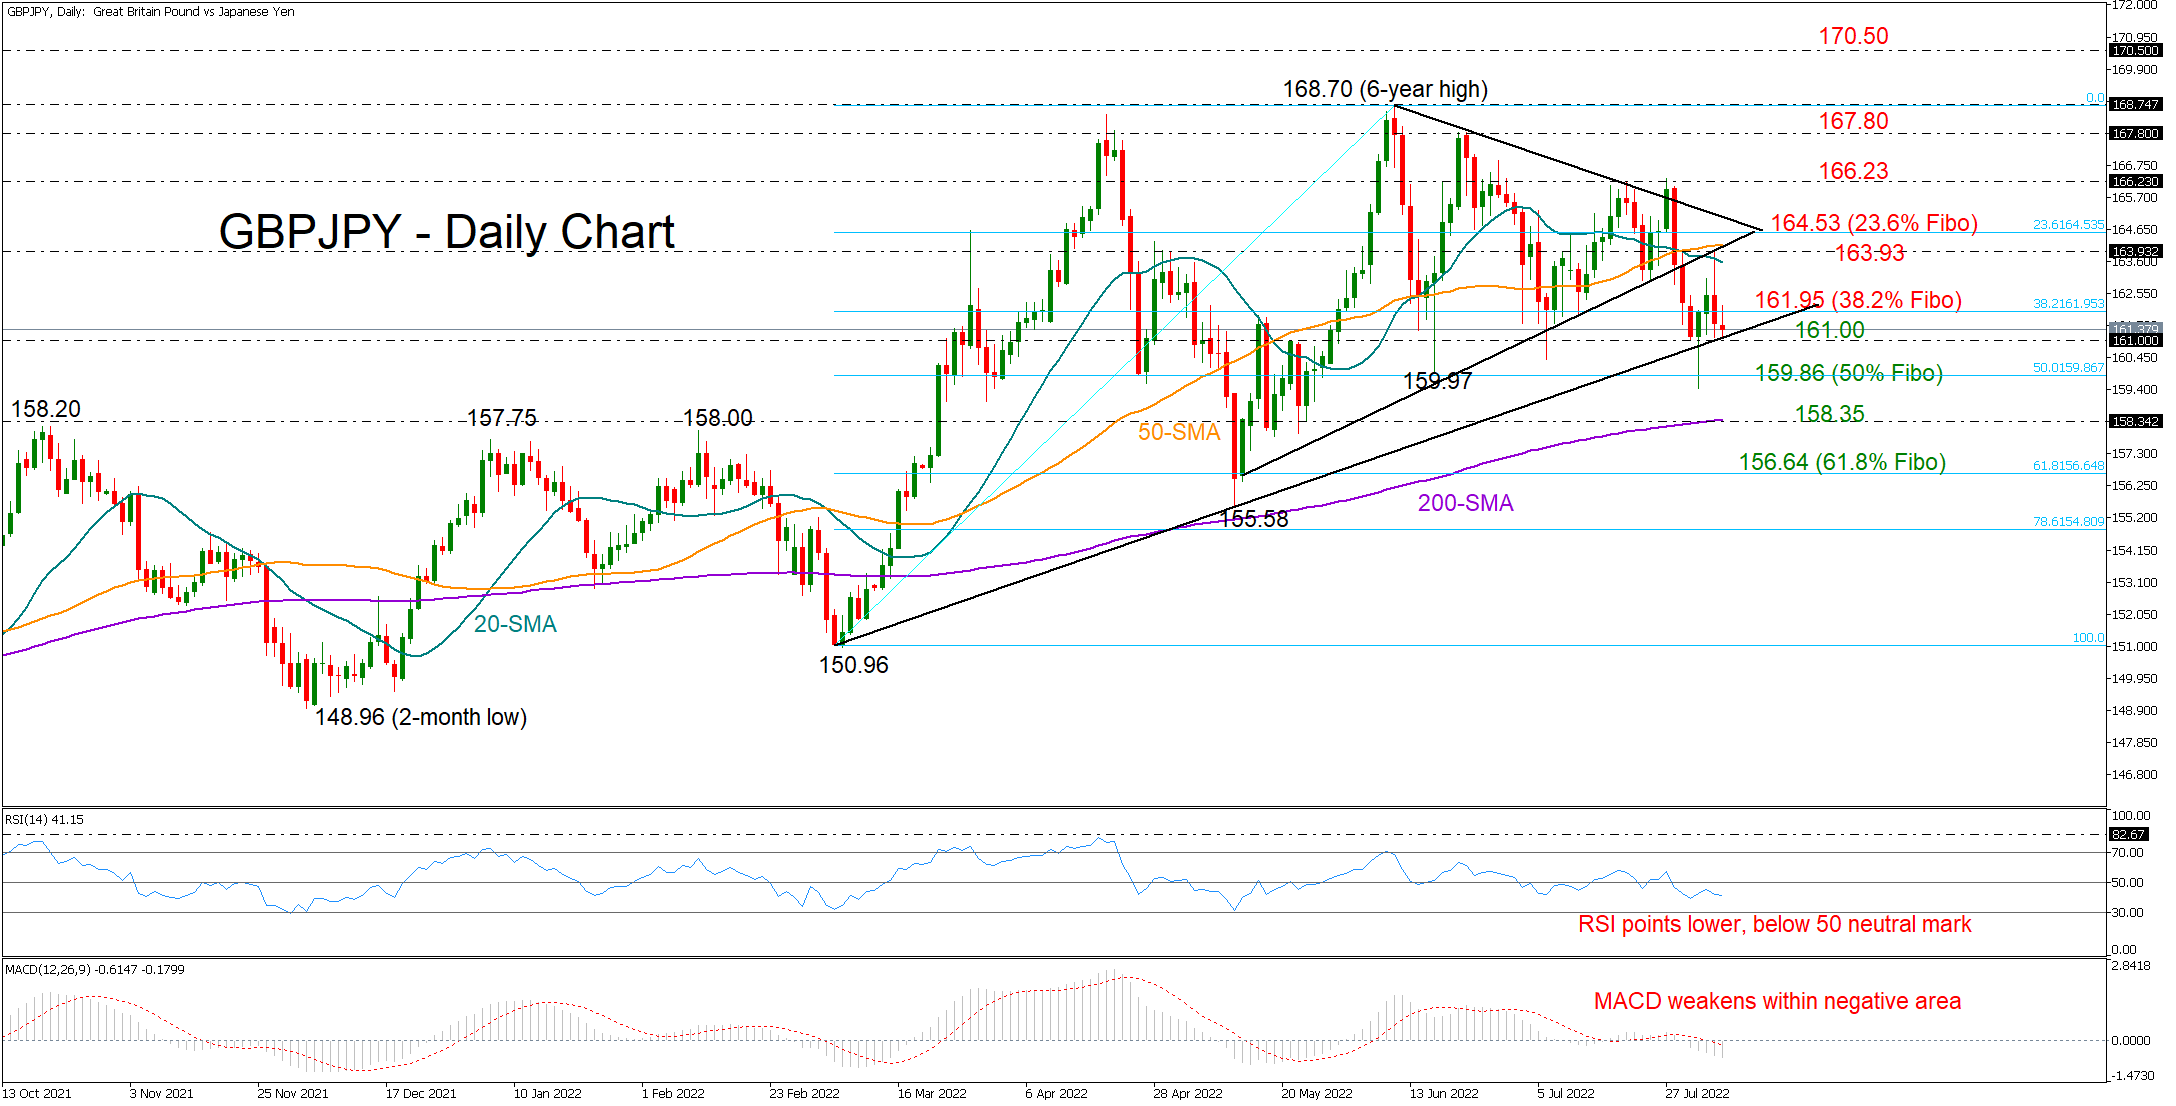
GBPJPY pulled back to test the support trendline at 161.00, which connects the lows from spring, after a failed attempt to pierce its 20- and 50-day simple moving averages (SMAs) around 164.00 on Thursday.
From a technical perspective, sellers seem to have the upper hand as the MACD keeps decelerating within the negative zone and the RSI is reversing southwards, putting in some distance below its 50 neutral mark.
If the bears finally achieve a close below the ascending trendline, the 159.86 area, which coincides with the 50% Fibonacci retracement of the 150.96 – 168.70 upleg, could come to the rescue, rejecting any declines towards the 200-day SMA at 158.35. Should the downfall sharpen below the latter, neutralizing the broad picture, the spotlight will turn to the 61.8% Fibonacci of 156.64.
On the upside, a durable move above the 38.2% Fibonacci of 161.95 may shift attention back to the 20- and 50-day SMAs currently at 163.55 and 164.00 respectively. The 23.6% Fibonacci and the key resistance trendline are also within a breathing distance at 164.53 and could deter any improvement towards the 166.23 border. Nevertheless, if upside pressures persist, traders will next target the 167.80 – 168.70 ceiling.
In brief, GBPJPY continues to face negative risks despite finding a strong footing near an upward-sloping trendline. A close below 161.00 could set the stage for the next bearish round.
Author

Christina joined the XM investment research department in May 2017. She holds a master degree in Economics and Business from the Erasmus University Rotterdam with a specialization in International economics.


