GBP/JPY rebounds swiftly from its sharp drop [Video]
![GBP/JPY rebounds swiftly from its sharp drop [Video]](https://editorial.fxstreet.com/images/Markets/Currencies/Crosses/GBPJPY/iStock-1151541926_XtraLarge.jpg)
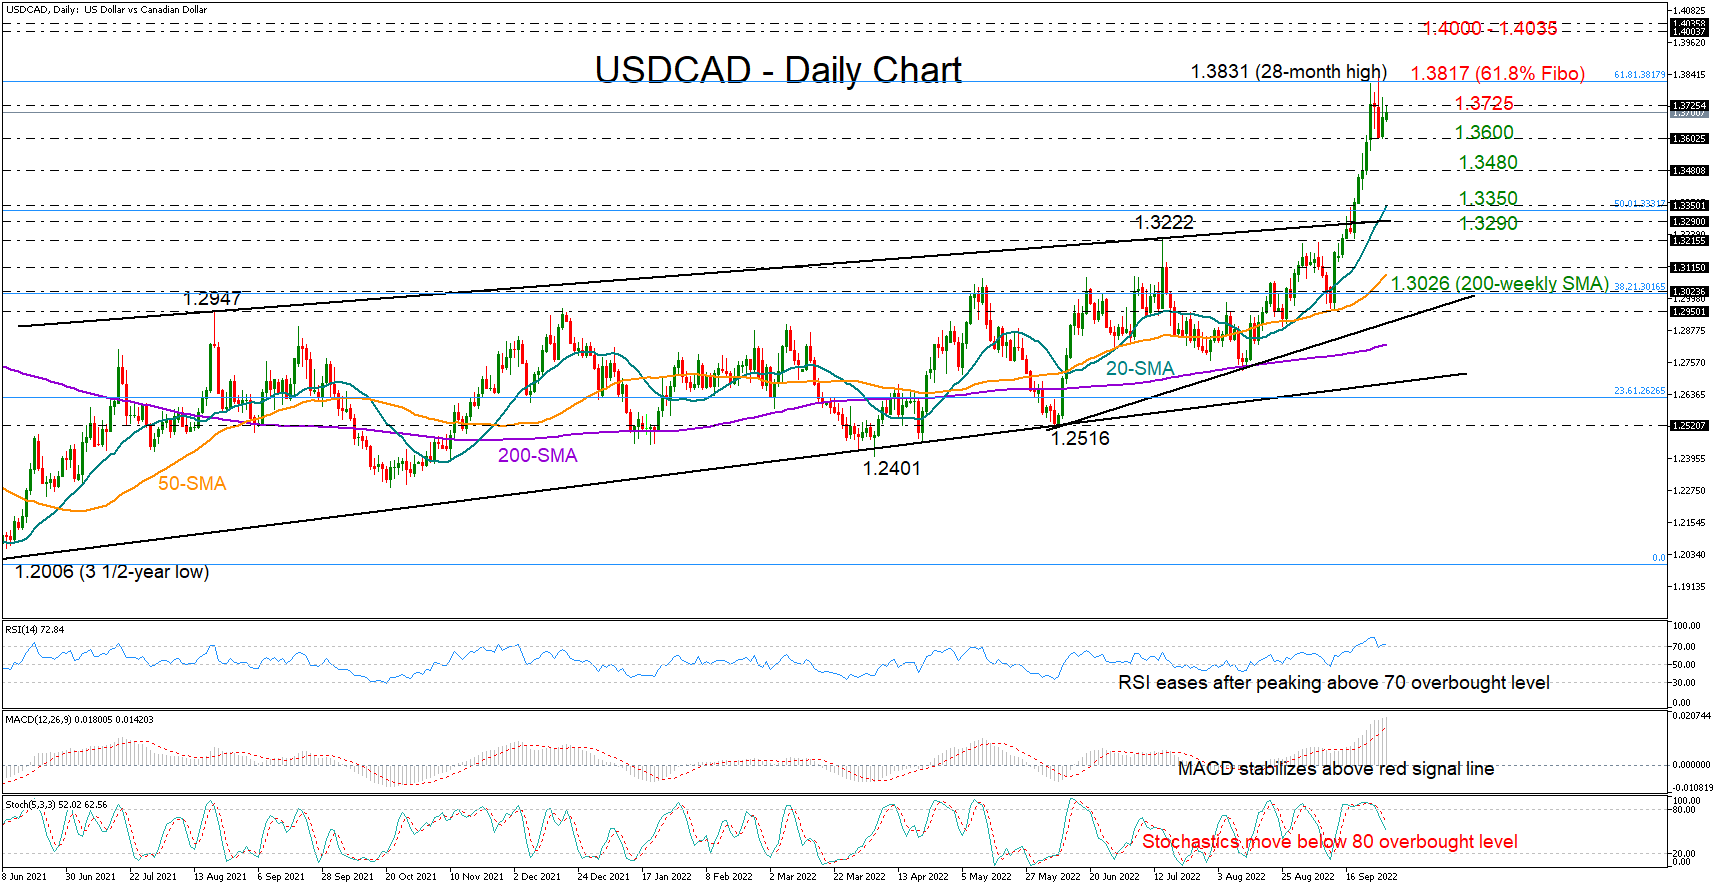
USD/CAD curbs exponential growth; support at 1.3600
USDCAD switched to consolidation after its exponential advance above a bullish channel topped at 1.3831. Of note, the area coincides with the 61.8% Fibonacci retracement of the March 2020 – June 2021 downtrend.
Encouragingly, the 1.3600 region helped the market to retain some weekly gains, but with the RSI and the stochastics hovering in overbought waters, it’s questionable how far the rally could still go. Nevertheless, with the indicators remaining elevated within the bullish territory, there might be some room for further improvement before the next bearish wave starts.
Should the pair propel buying interest above the key resistance area of 1.3725–1.3831, the rally could pick up steam towards the 1.4000–1.4035 region taken from March-May 2020. Breaching that wall too, the next barricade could pop up around 1.4140.
Alternatively, a downside reversal may retest the support of 1.3600. If that proves easy to break this time, the sell-off may continue towards the 1.3500 round level. Moving lower, the 20-day simple moving average (SMA) at 1.3347 will attempt to keep the broad outlook positive above the channel.
In brief, USDCAD is preserving a bullish outlook in the short- and long-term picture, though with the price trading within overbought territory, fears that the uptrend has peaked may keep weighing on market sentiment.
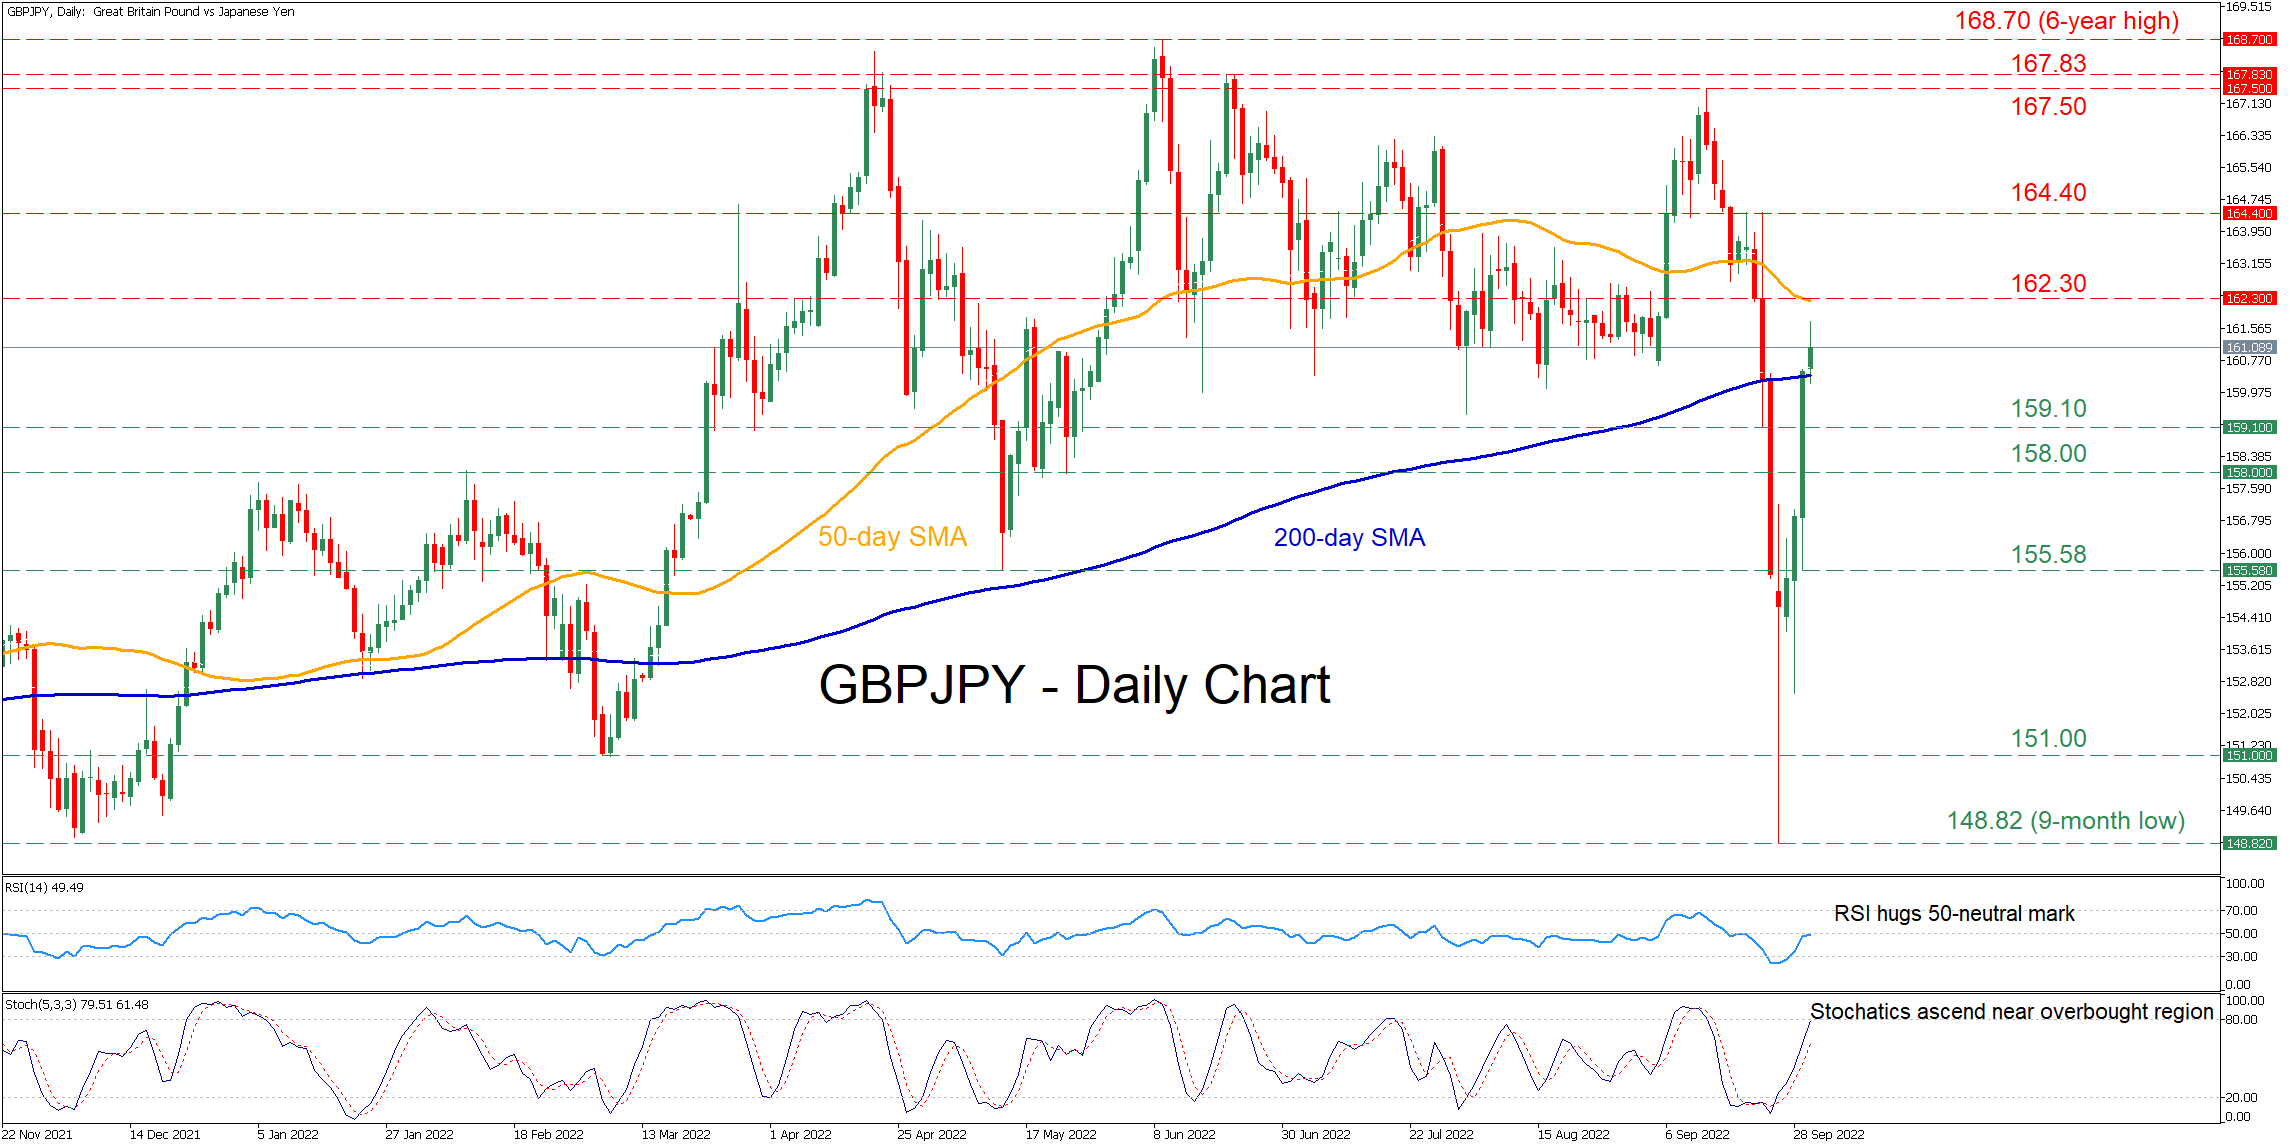
GBP/JPY rebounds swiftly from its sharp drop as bias turns bullish
GBPJPY has experienced some large moves in the short term, with the price losing around 10% before it recovers back above the 160.00 mark. Moreover, the technical picture is currently endorsing the resumption of the rebound as the pair has forcefully crossed above the ascending 200-day simple moving average (SMA).
The momentum indicators suggest that near-term risks are tilted to the upside. Specifically, the stochastic oscillator is ascending near the 80-overbought region, while the RSI has rebounded from the oversold zone, currently touching the 50-neutral threshold.
If buying pressures persist, the pair could initially challenge the 50-day SMA, currently at 162.30. Surpassing this zone, the bulls might aim for the recent resistance region of 164.40 before the September peak of 167.50 appears on the radar. A break above the latter may bring the June high of 167.83 under examination.
To the downside, should the price decline below its 200-day SMA, the recent low of 159.10 could act as the first line of defense. Sliding beneath that floor, the pair might descend towards 158.00, which has acted both as support and resistance during 2022. Failing to halt there, the May low of 155.58 could then provide significant downside protection.
Overall, GBPJPY has been exhibiting huge volatility in the short term, with the pair managing to erase a huge chunk of its steep decline within four daily sessions. For the recovery to continue, the pair must decisively cross above its 50-day SMA.
Author

Christina joined the XM investment research department in May 2017. She holds a master degree in Economics and Business from the Erasmus University Rotterdam with a specialization in International economics.


