USD/CAD Charts Bearish Reference Candle on Weekly Time

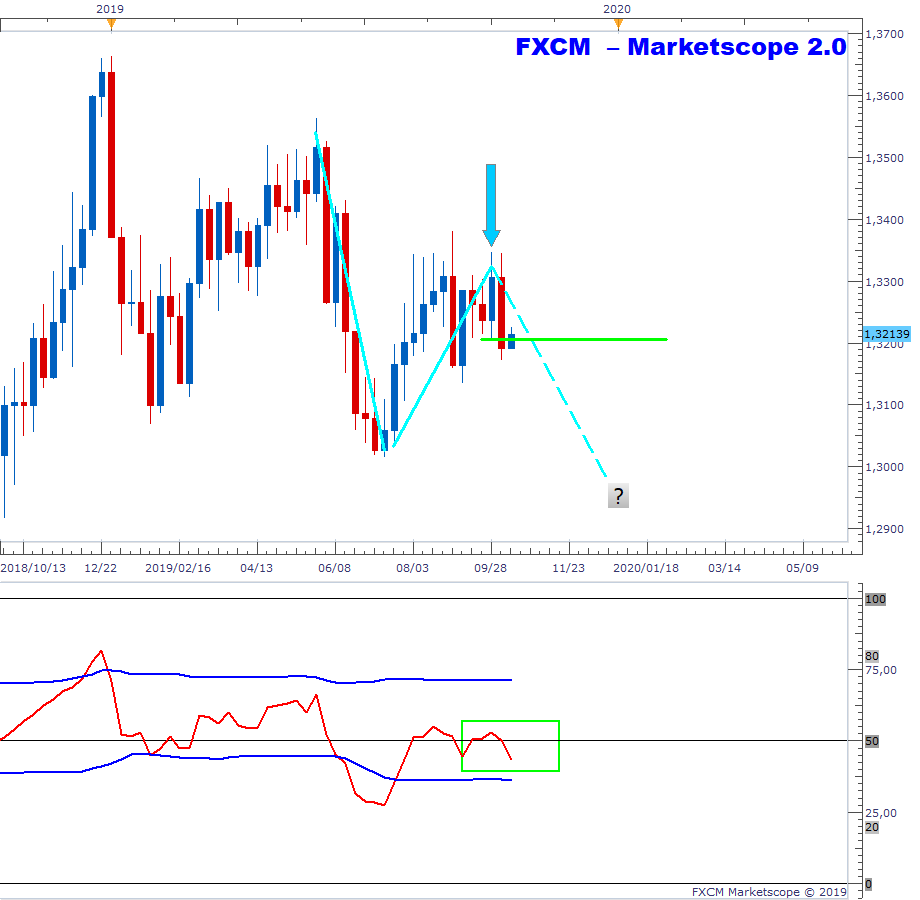
The below is the weekly chart of the USDCAD. The candle from two weeks ago is a bearish reference candle (blue arrow) i.e. it has the highest high of a 3-candle pattern. Last week’s candle broke below and closed below the reference candle’s low (green horizontal). The RSI has also dipped below 50 which is suggestive of an underlying bearish momentum (green rectangle). If the reference candles is a bona fide turning point we may see the next impulse move down (broken aqua line). We continue to monitor.
Past performance is not an indicator of future results.
CHART SOURCE: FXCM MARKETSCOPE 2.0
Author

Russell Shor (MSTA, CFTe, MFTA) has an Honours Degree in Economics from the University of South Africa and holds the coveted Certified Financial Technician and Master of Financial Technical Analysis qualifications from the Interna


