USD vs Gold - relative strength analysis

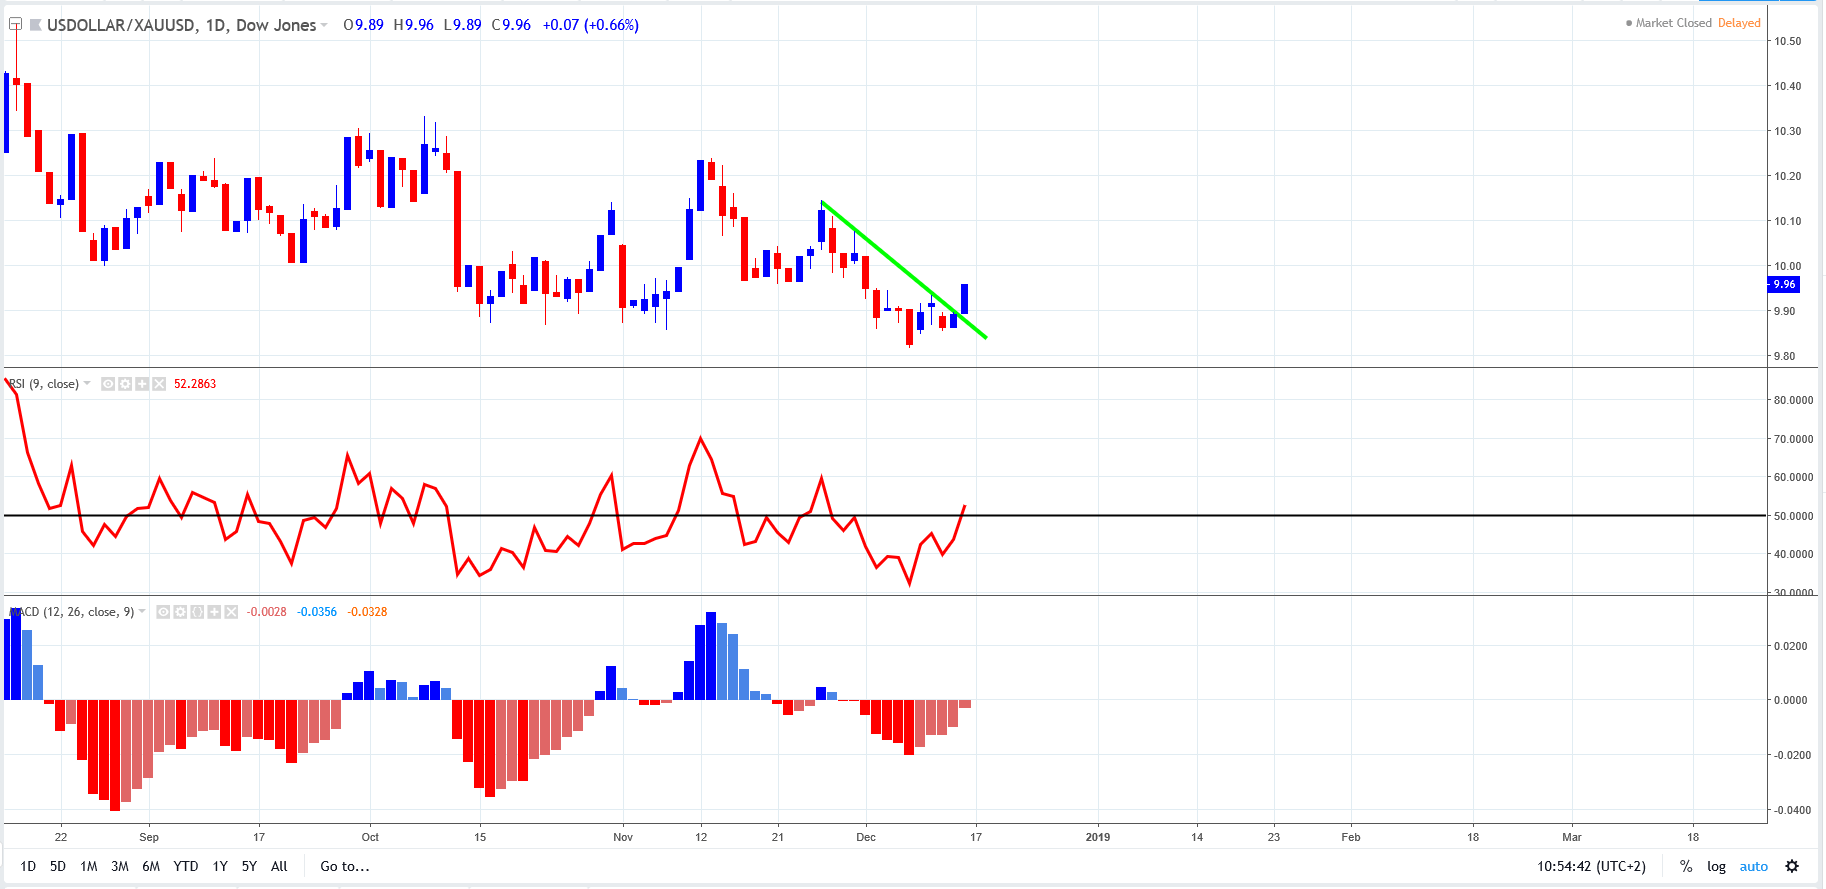
The above chart shows daily price action of USDOLLAR:XAUUUSD. The ratio has broken above its green downsloping trendline. This is indicative of a slowdown in the downwards momentum. Moreover the RSI(9) has crossed above 50 and the MACD histogram is ticking up. We are assessing if there is a change in leadership here with the greenback starting to outperform gold.
Author

Russell Shor (MSTA, CFTe, MFTA) has an Honours Degree in Economics from the University of South Africa and holds the coveted Certified Financial Technician and Master of Financial Technical Analysis qualifications from the Interna
More from Russell Shor, CFTe, MFTA


