USD/TRY about to fire in 3...2...1

The Bollinger Band Indicator was developed by John Bollinger back in the 80s. It’s an indicatorthat is widely used amongst traders and analysts. Bollinger Bands consist of a centerline (20period moving average) and two price channels above and below the centerline, commonlyknown as the bands. The bands envelope price action which helps traders and analystsdetermine whether prices are high or low on a relative basis, and are a measure of volume andmomentum.
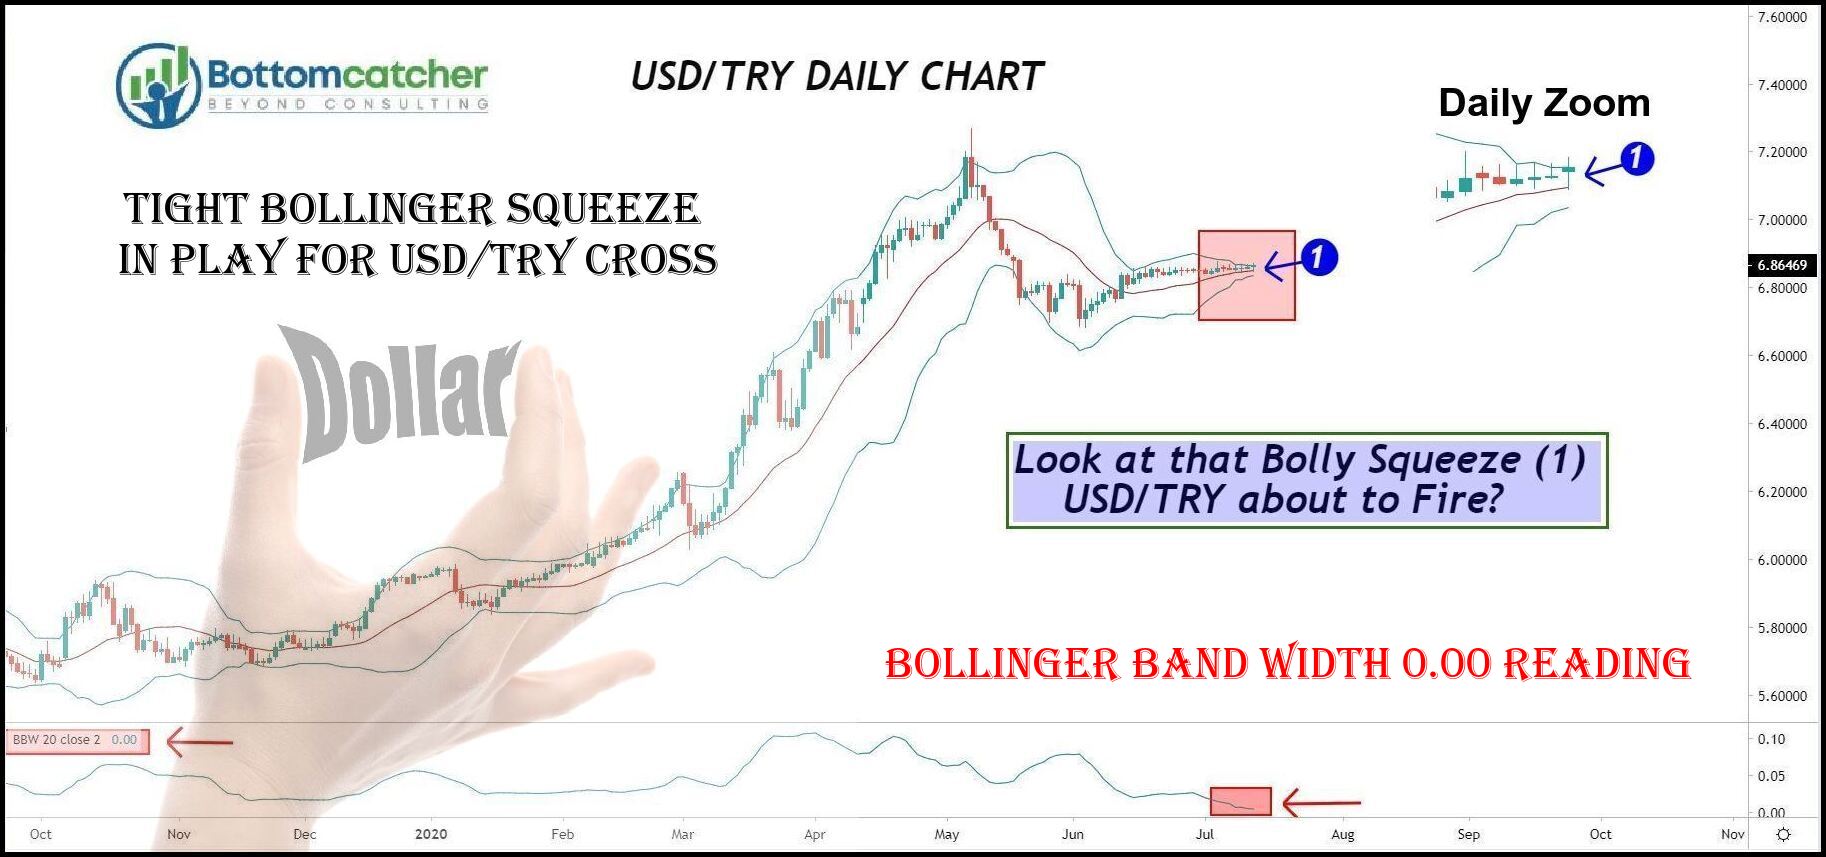
Today’s chart illustrates a Bollinger Squeeze in Play (on the daily chart), this occurs whenvolatility drops too low levels causing the bands to narrow. Periods of low volatility are usuallyfollowed by periods of high volatility. Therefore a volatility contraction of the bands oftenindicates a future advance or decline. In order to determine ‘when’ an advance or decline isabout to take place, we need to pay attention to the ends of the upper and lower bands. Forexample, If the US Dollar (USD) is going to advance on the Turkish Lira (TRY) the upperBollinger Band will flare to the upside and conversely, the lower Bollinger Band will flare to thedownside, suggesting volume is picking up and a new trend is perhaps underway.
The Bollinger Band Width Indicator also helps traders and analysts determine how tight thenarrowing of the bands actually are. In this USD/TRY chart, we have a Bollinger Band Widthreading of 0.00, it doesn’t get much tighter than that. Bandwidth decreases as Bollinger Bandsnarrow and increases as Bollinger Bands widen.
Author

Steven Mylonas
Bottomcatcher.com
With more than 20 years of experience, Steven has a broad knowledge of market strategies and the markets in general, with a strong focus and understanding of data reading.


