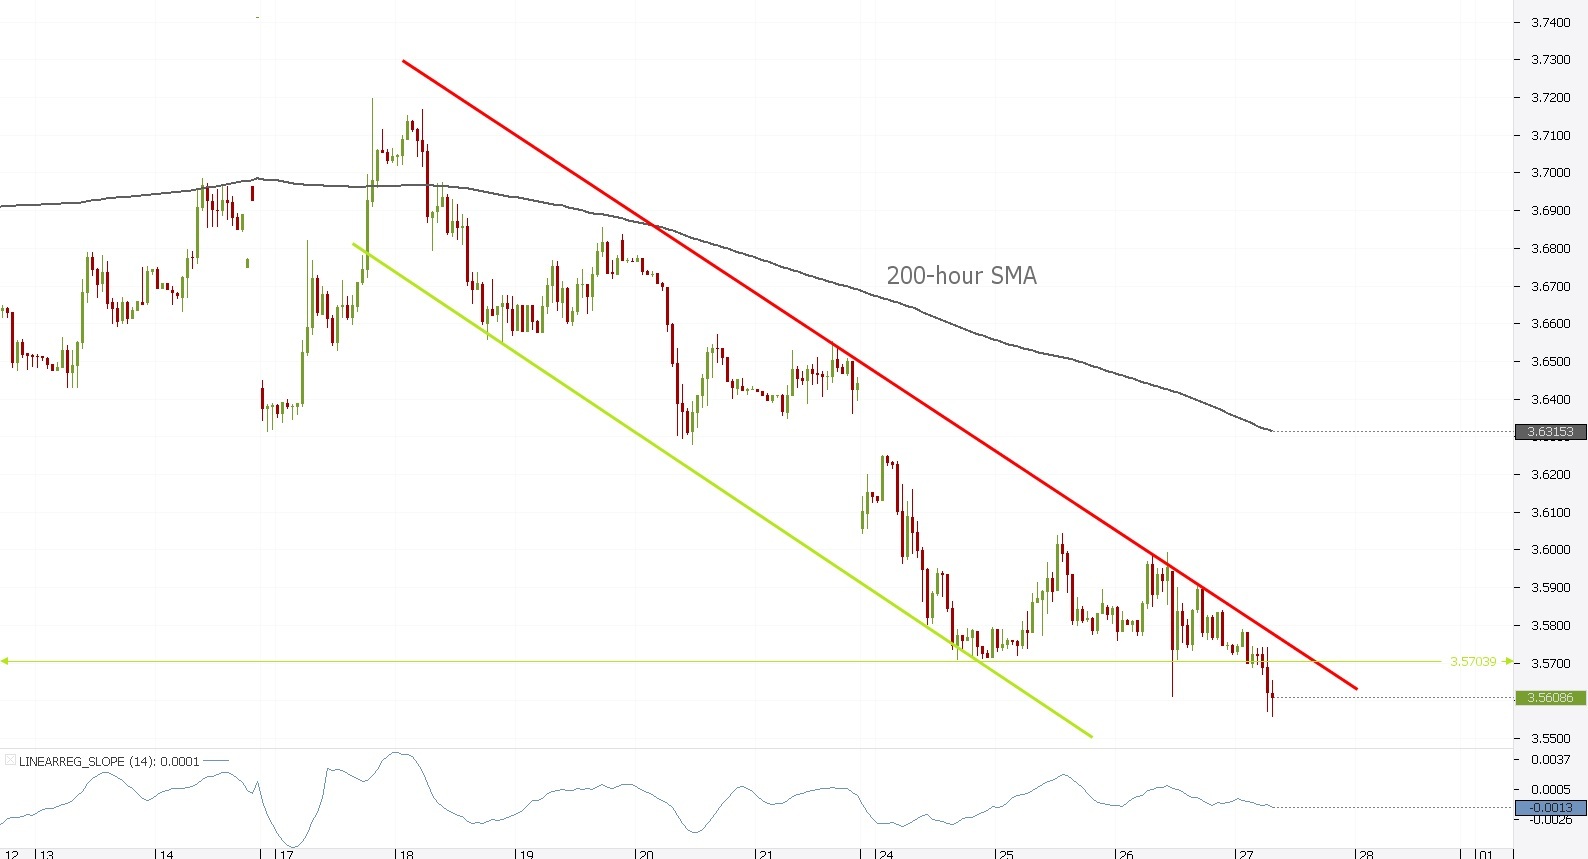
USD/TRY 1H Chart: Channel Down

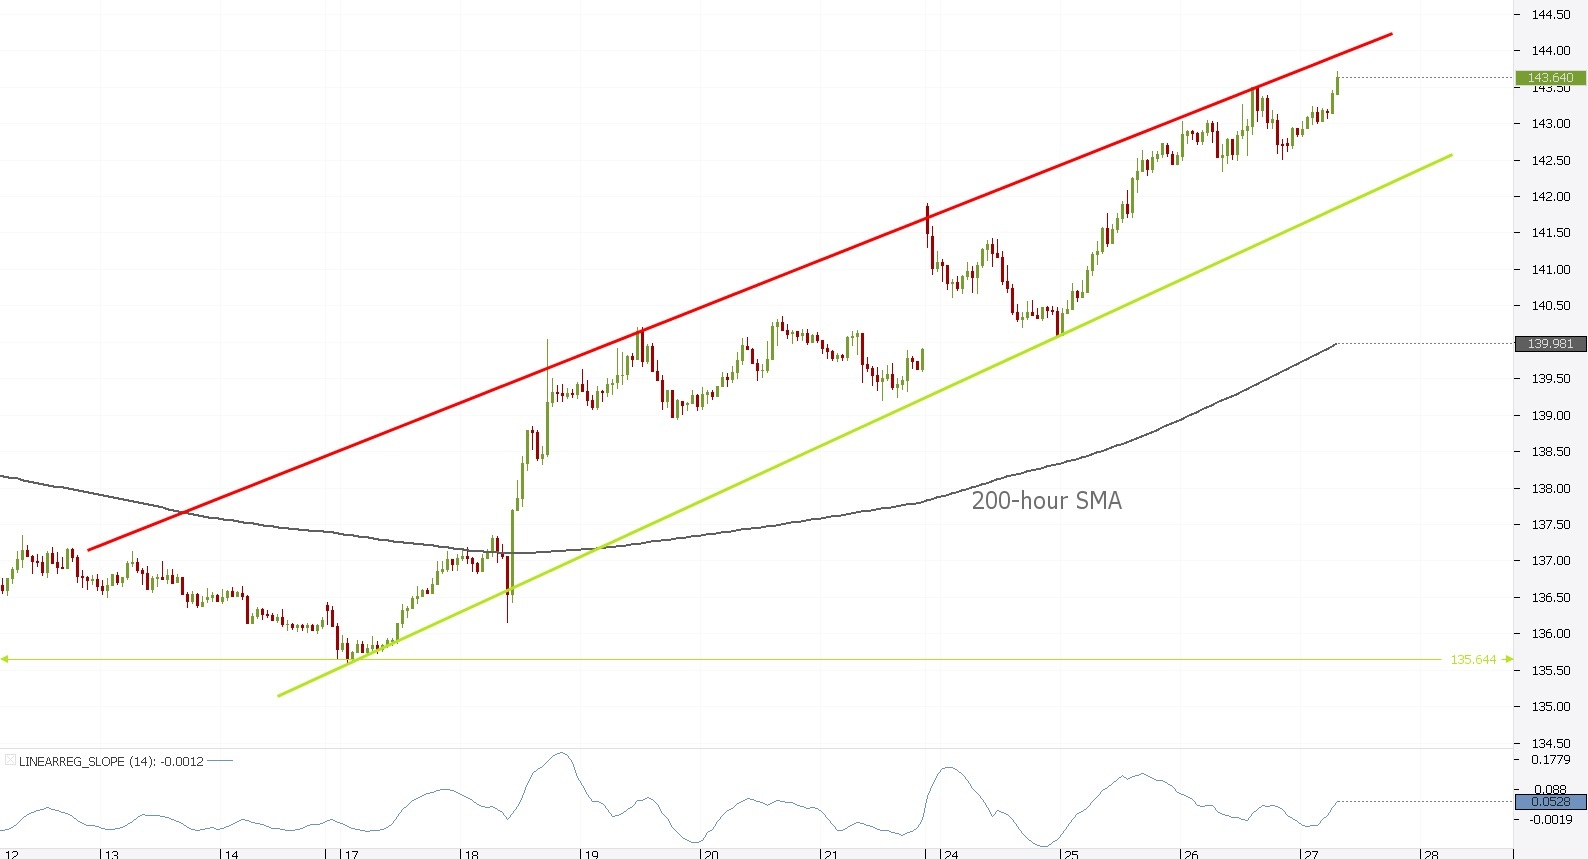
GBP/JPY 1H Chart: Rising Wedge
Comment: A steep rally followed the second test of 135.64 that was launched April 17, but has now lost some of the momentum and sketched a rising wedge on the hourly chart. GBP/JPY has just tapped at the upper trend-line of the pattern and should, in theory now move on to the bottom bound near 142.58, however, it seems to be sticking around and might be launching another attack on the upper part of the pattern. In case the up-wave continues, 143.96 will be the target for now, while immediate support rests at 143.37.
USD/TRY 1H Chart: Channel Down
Comment: USD/TRY is showing some decent bearishness in a channel down pattern which has just led to a step beneath the February low at 3.5704, after several tests of the area. While currently it appears that the pair has indeed plunged beneath the area and might set a solid dip into motion, upside risks cannot be eliminated and a break above the channel upper trend-line at 3.5769 would strongly confirm the strength of the aforementioned level. The cross is currently being held by the bottom Bollinger Band at 3.5603 and could slip to 3.5576 for a more prominent test.
Author

Dukascopy Bank Team
Dukascopy Bank SA
Dukascopy Bank stands as an innovative Swiss online banking institution, with its headquarters situated in Geneva, Switzerland.


