USD/SGD Elliott Wave analysis expects extensive decline
In this one, we will discuss the future path for the USDSGD forex pair based on the Elliott wave theory. The path will include both long-term ideas and where we can find opportunities along the shorter cycles. $USDSGD is one of the 78 instruments we analyze for and trade with members of Elliottwave-Forecast.
Since January 2024, the pair has been net positive with a bit over 2% gain. This is mostly a result of the Dollar rallies as this pair is largely driven by the performance of the dollar. Meanwhile, it appears the two instruments have reached extreme zones from where a decline in most of the second half of the year 2024 is now very likely.
USD/SGD Elliott Wave analysis, weekly chart 07.07.2024
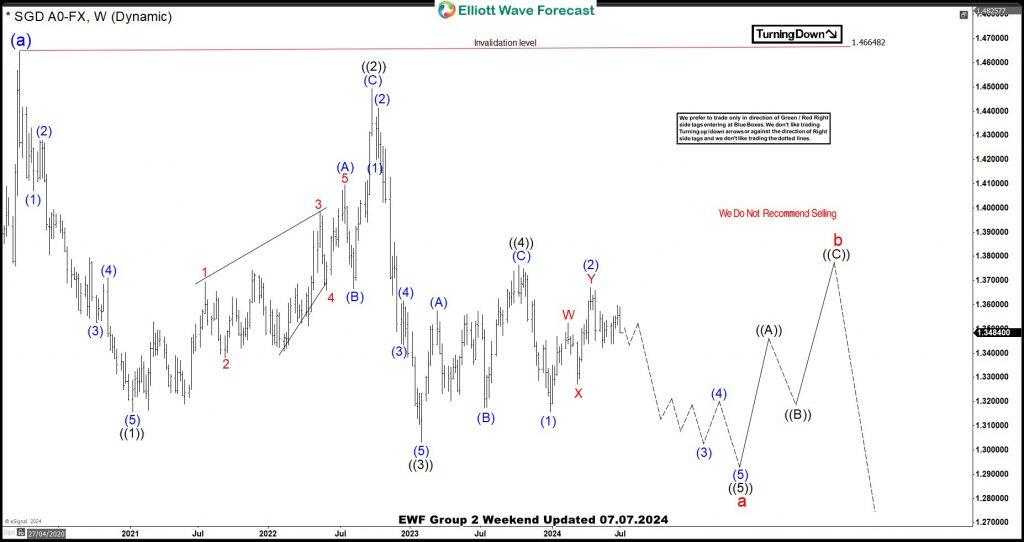
The weekly chart above, shared with members on 07.07.2024 shows the long-term future path. We reckoned that the pair is on a corrective bounce from July 2011. The rally from that time to March 2020 completed the first leg – wave (a) of the supercycle degree. The corresponding wave (b) of the same degree began and is subdivided into waves a-b-c of the cycle degree. Currently, the cycle degree wave a is evolving into a diagonal structure as the weekly chart above shows. Price appears to have competed wave ((4)) of a and is now favored to continue downside in wave (3) of ((5)). In addition, wave (3) could extend to 1.319 or even below. Thus, the pathway favors the downside and that has been our bias for the 2nd half of 2024. Unless something drastic happens, we would like to sell within the shorter cycles.
Meanwhile, waves 1 and 2 of (3) have completed 16th May and 24th June 2024. Thus, the price is extending lower in wave 3 of (3). Two things should happen in wave 3. First, it should evolve in an impulse wave structure. Second, it should breach the wave 1 low (16 May low) of 1.3420 and head much lower.
USD/SGD Elliott Wave analysis, one-hour chart – 07.11.2024
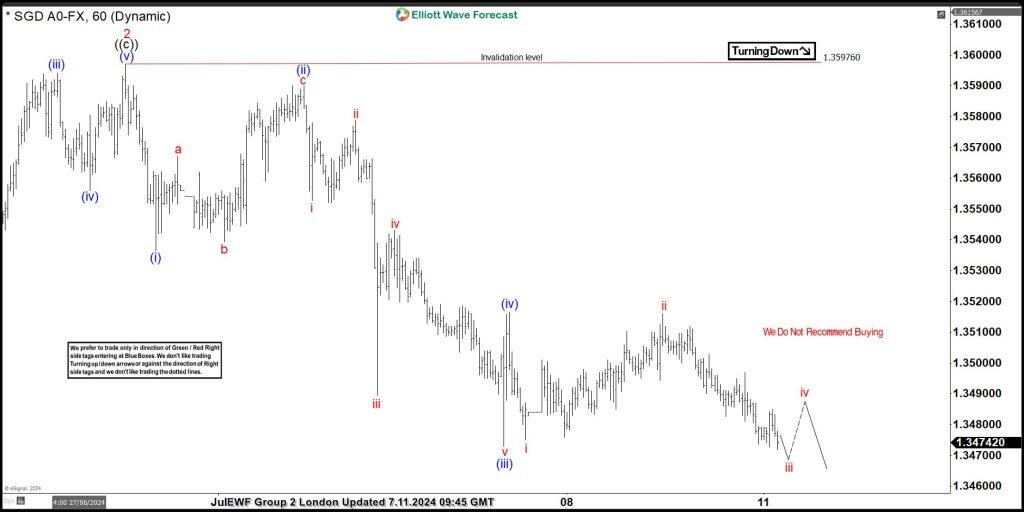
We shared the H1 chart above with members on 07.11.2024 to show the shorter cycles. Wave 2 of (3) ended at 1.3597 and then fell sharply to begin wave 3. Wave ((i)) of 3 is ongoing and shows incompleteness. Precisely, price is completing the sub-waves of (v) of ((i)). After ((i)) completion, we should see a rebound for wave ((ii)), and then the price should turn lower for ((iii)). However, wave ((ii)) rebound should end below 1.3597 wave 2 high, otherwise, the latter will extend higher. To deal better with this uncertainty, we can wait for the price to breach wave 1 low at 1.3420 with an impulse structure. By that, we can be sure that wave 2 has ended. Consequently, traders can sell bounces in 3,7, or 11 swings at the extreme along the direction of waves ((i)), ((iii)) and ((v)) in the near term.
Members receive hourly updates four times a day and can use our forecasts as guides for their trading strategies. On each chart, we indicate the trading direction to consider. In the live trading room, members have access to trade signals and trade management guides. In addition, members can chat with our analysts 24 hours from Monday to Friday.
Author

Elliott Wave Forecast Team
ElliottWave-Forecast.com


