USD Setting Itself Up For Next Upleg

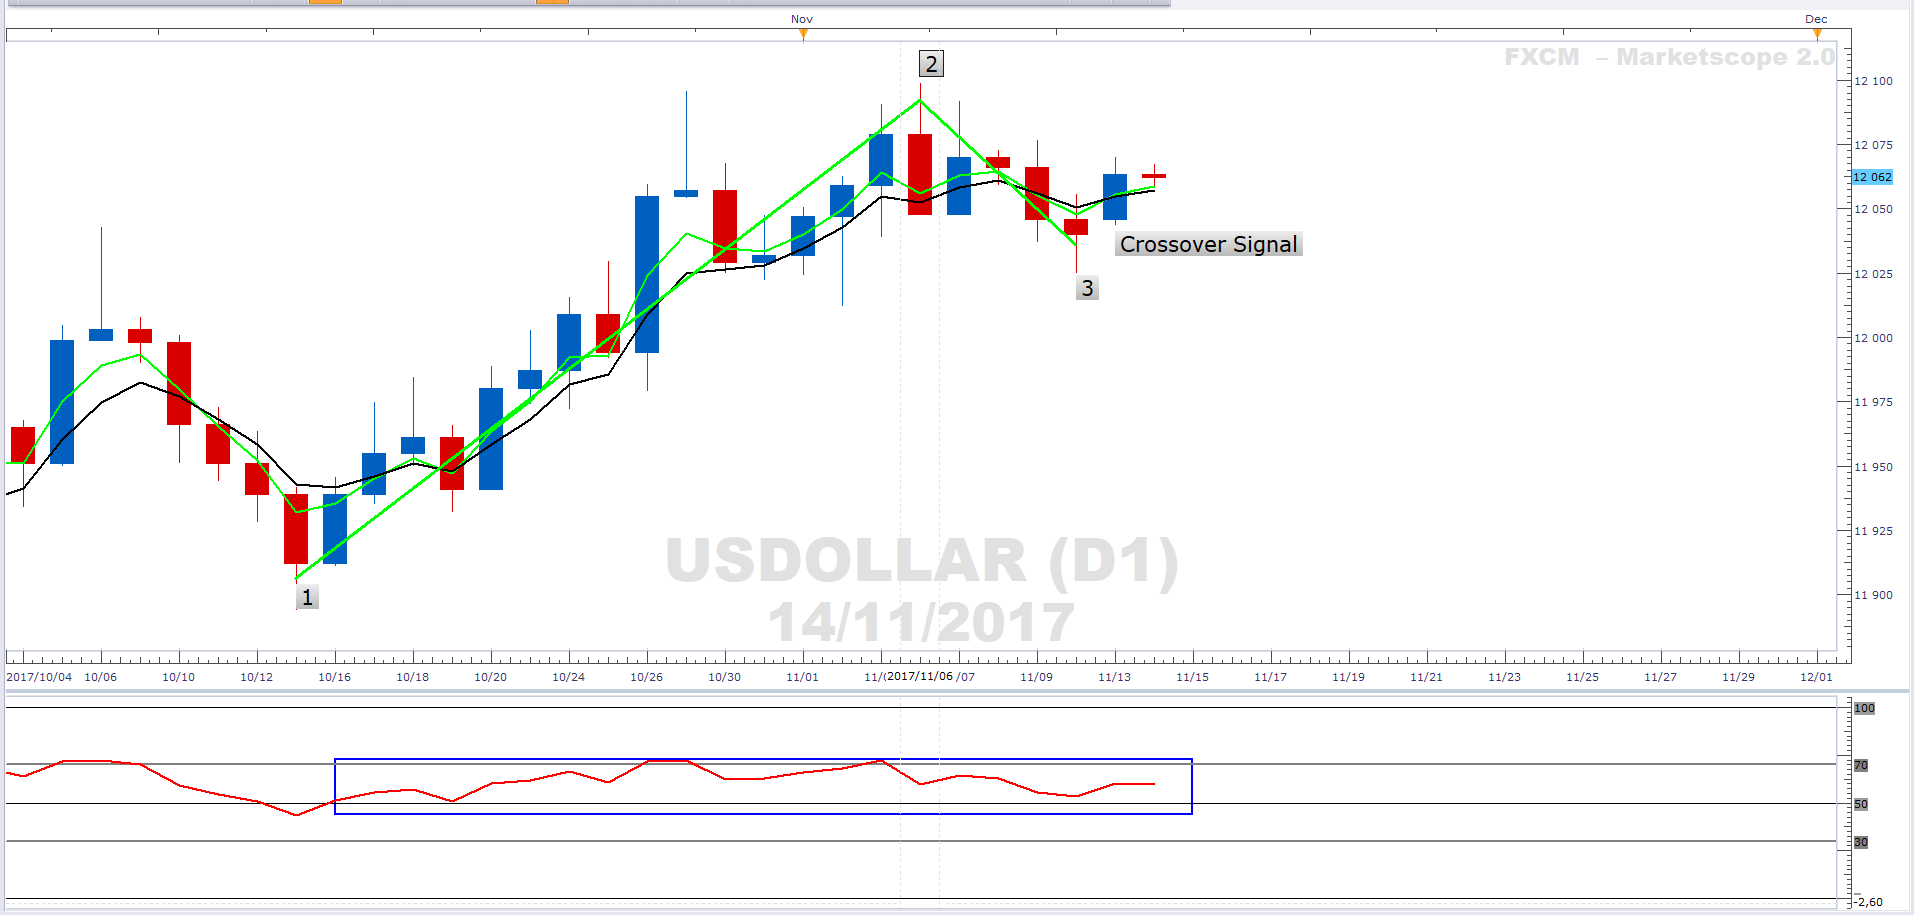
Daily
-
The US Dollar Index (USD) has charted a bullish 1-2-3 pattern.
-
It looks as if the 2-3 correction has completed.
-
The green 3-day EMA has crossed above the black 5-day EMA (golden cross)
-
The RSI(9) is above 50 and is supportive of upside momentum.
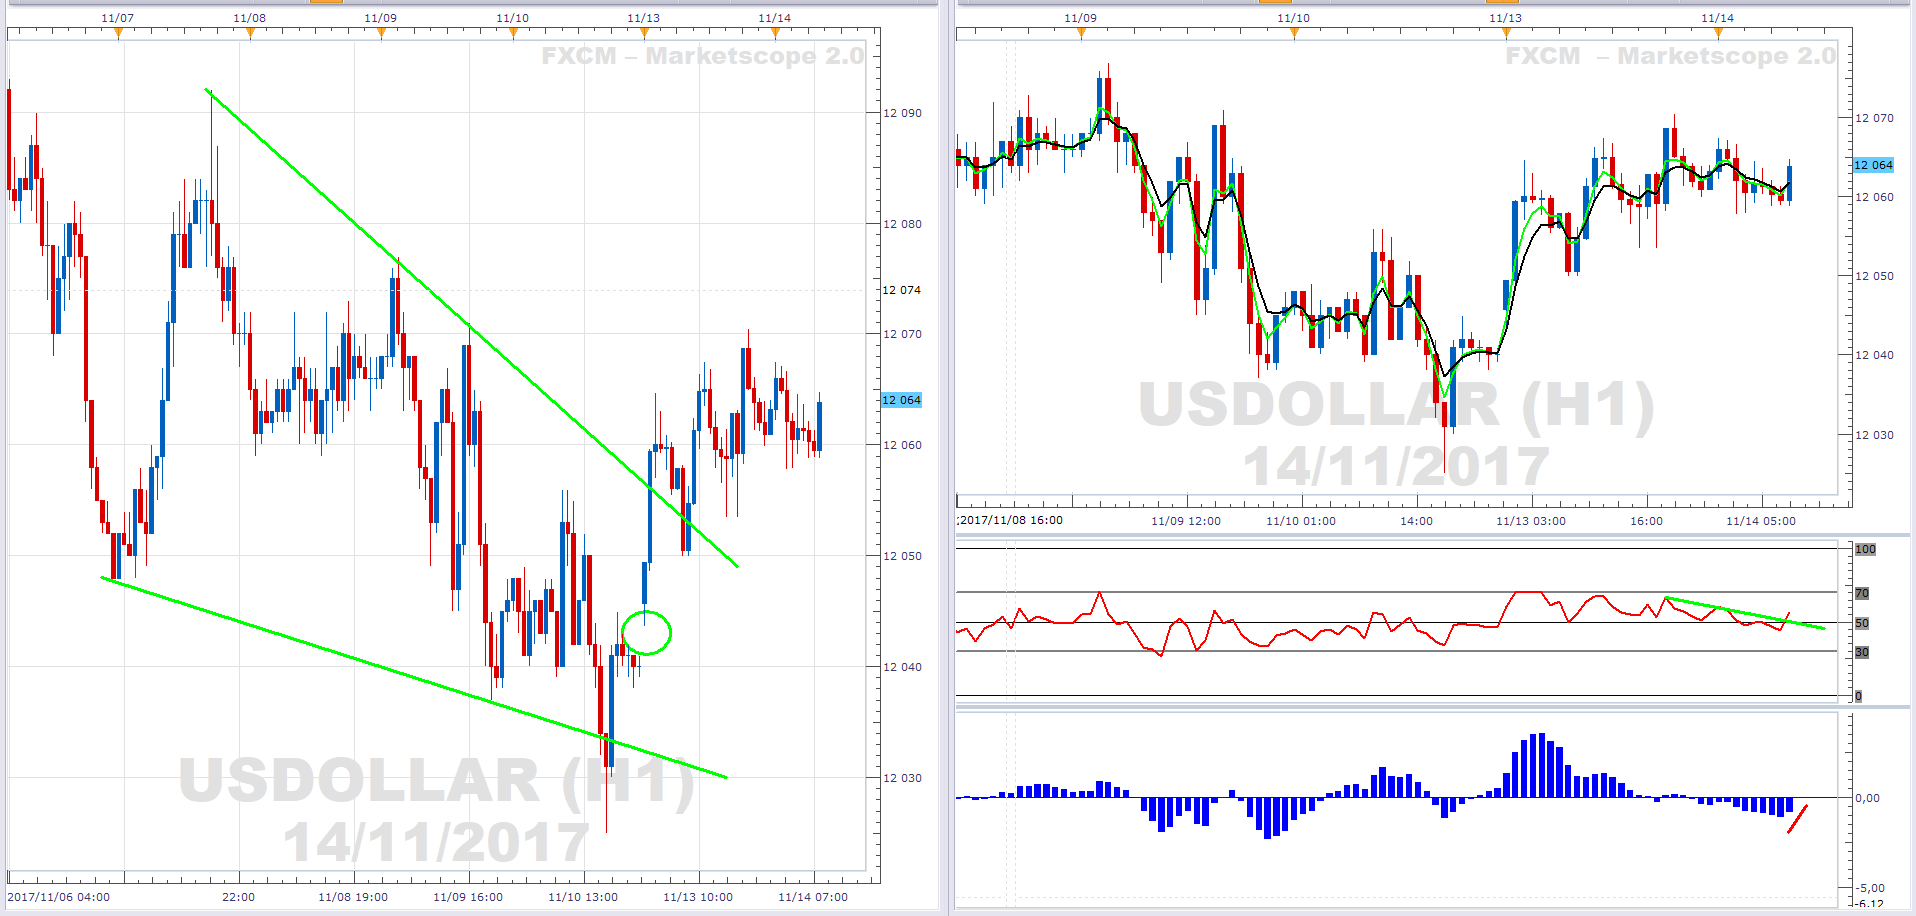
Hourly
-
The left pane shows the USD from 6 Nov.
-
Price gapped up on the open for the week (green circle).
-
The index has broken out of a bullish wedge and is holding above the pattern.
-
-
The right pane shows the USD from 8 Nov.
-
The green 3-hour EMA has crossed above the black 5-hour EMA (golden cross).
-
The RSI(9) is above 50 and broken above the green down sloping trendline.
-
The MACD histogram is ticking up (red trendline).
-
Conclusion
-
A bullish 1-2-3 pattern has charted on the daily and there has also been a golden cross.
-
The RSI(9) is positioned to support further upside.
-
The hourly chart has price above a bullish wedge.
-
This has support from the hourly trend following indicators and the RSI(9) and MACD histogram oscillators.
-
We expect price appreciation ahead.
Author

Russell Shor (MSTA, CFTe, MFTA) has an Honours Degree in Economics from the University of South Africa and holds the coveted Certified Financial Technician and Master of Financial Technical Analysis qualifications from the Interna


