USD/MXN: In a search for a trending instrument

One of my students has sent me recently an interesting situation from the Mexican Peso chart (USDMXN). It shows quite clearly the mechanics of a trending market. Let’s go through this situation since it can be quite interesting for educational purposes.
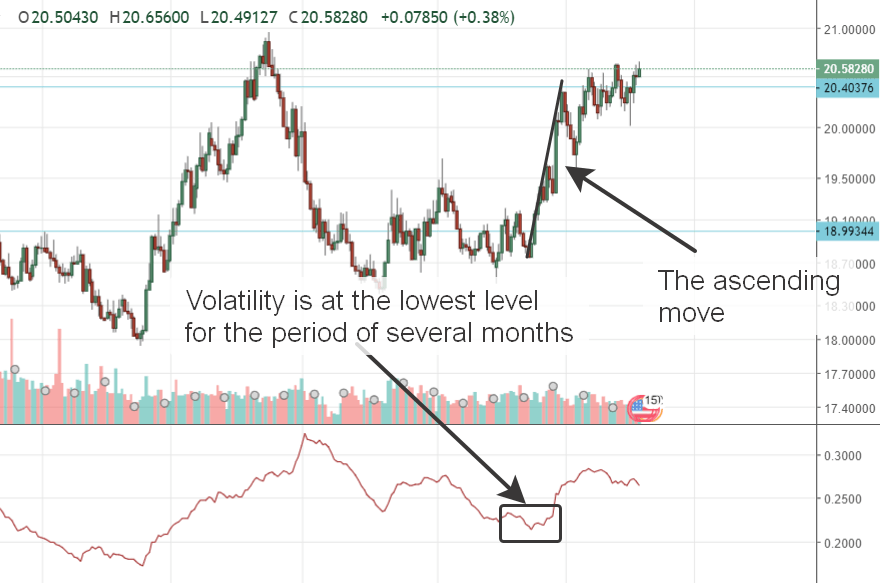
Clue №1. The move had started when there was a dip on ATR(21).
Take a look at the move on a daily chart of USDMXN. It had soared after October 18, when volatility was at the lowest relative level for the period of several months. Usually, big trends occur when volatility drops.
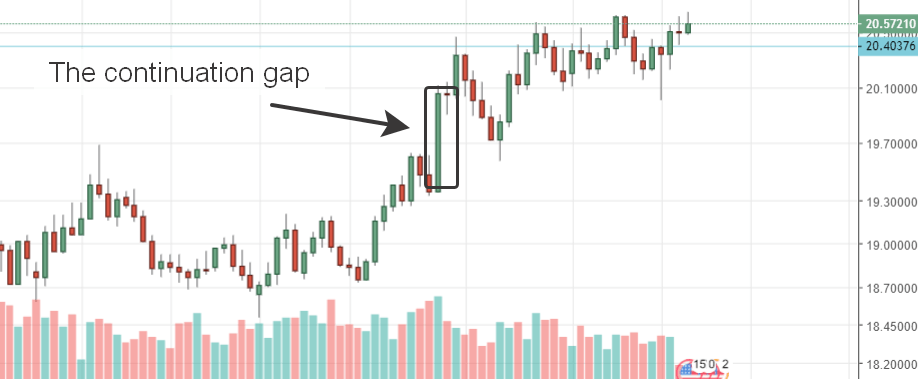
Clue №2. The continuation gap.
That’s not really a gap. I call it a gap because the price behaves similarly in such situations like in a gap related ones. We see a big day which distinguishes one trading range from another. It means that the price had repositioned to a new value area (with continuation in the direction of the trend).
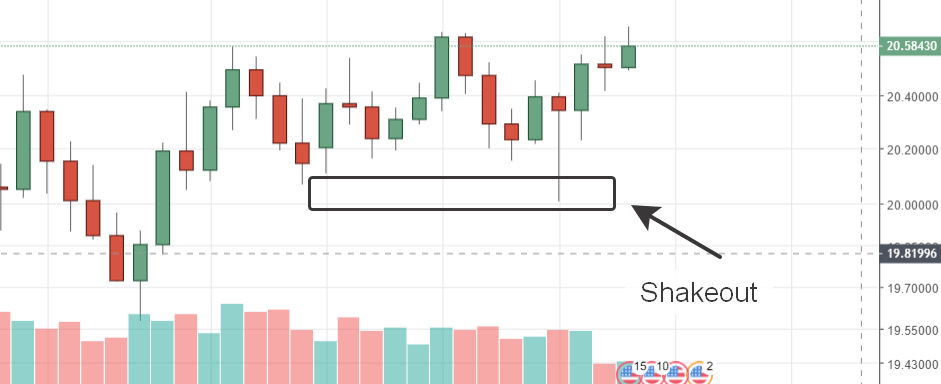
Clue №3. The shakeout.
It is not only important to find a good trend, but also to pick a good entry point in the direction of this trend. When the trend develops for already more than 2 months, it is no longer in an impulse phase. It starts rotating back and forth, and normally, it is quite difficult to enter a trade with a small stop in this case. Well, unless we see a shakeout to the opposite direction, just like we’ve seen on USDMXN.
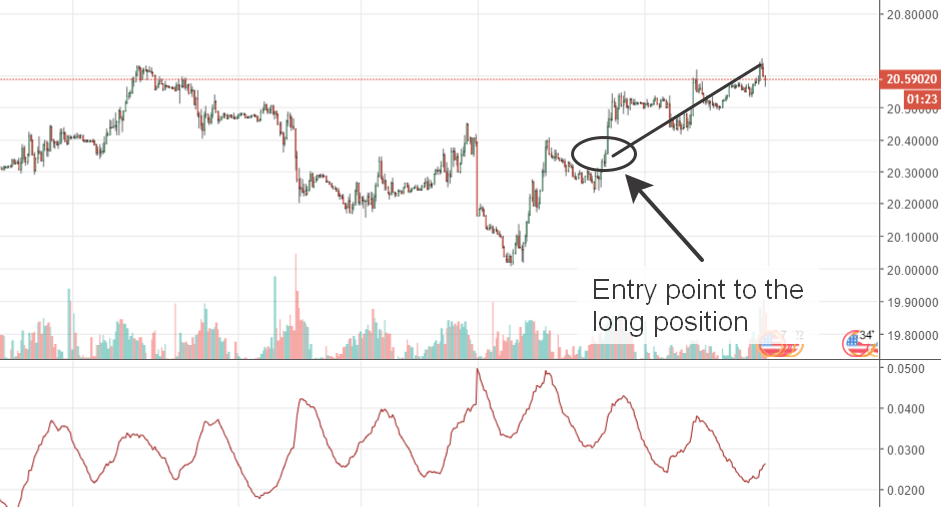
Clue №4. The trading tactics.
Of course, it is very difficult to enter during a shakeout, not only emotionally, but also with a limited risk. You will have to have your stop placed at a very distant level.
That’s why, you can simply wait for the pullback, and then to play a breakout trade in the direction of the trend.
That’s a simple 4-step process, which you can start implementing in your trading today. Take a look at your charts: do you see a strong trending market now on any of your favourite trading instruments?
Good luck and have a good trading day ahead!
Author

Stanislav Bernuhov
Common Sense Trading
I'm an individual trader since 2004 and a trading coach since 2010.


