USD/JPY Weekly Forecast: The dollar’s perfect storm versus the yen
- USD/JPY reaches two decade high on Friday at 126.69.
- US Treasury yields resume their run, 10-year at 2.827%.
- Federal Reserve officials continue to tout higher rates.
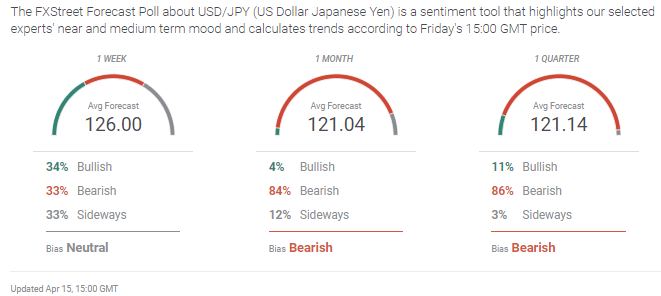
- FXStreet Forecast Poll predicts a mean reversion in USD/JPY.

The USD/JPY rose to a two-decade high at 126.69 in Friday’s holiday thinned market, capping a 1.7% gain for the week, a 3.9% increase since April 1 and a 10% jump from March 1.
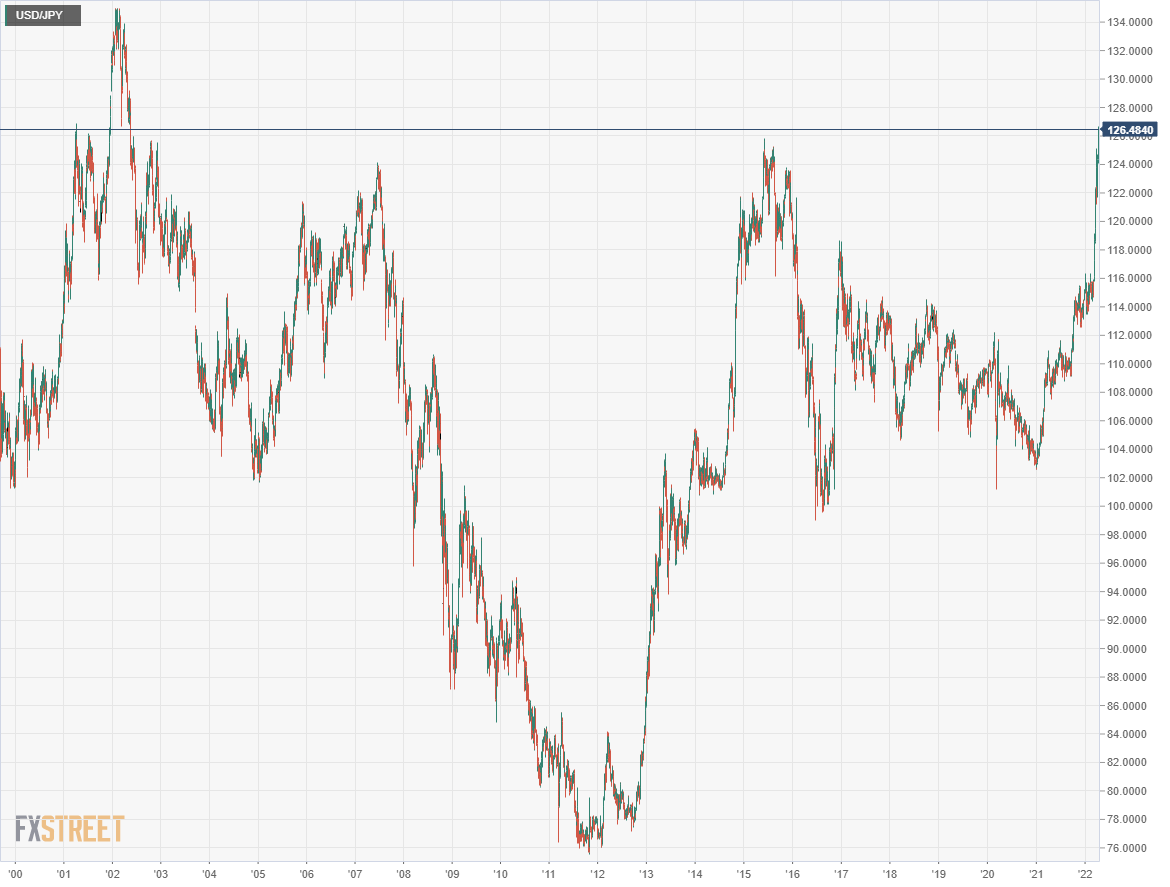
Inflation bolstered US Treasury yields and an aggressive Federal Reserve rhetorical campaign, combined with the risks of a stalemated but still dangerous Ukraine war and the Bank of Japan’s (BoJ) seemingly permanent liquidity policy, has made a near perfect environment for the greenback against the yen.
The European Central Bank (ECB) helped the dollar’s cause, even if not specifically referencing the yen, when President Christine Lagarde declined to alter monetary policy. Citing the very real threat of the Ukraine war to economic growth, the bank left its base and deposit rates unchanged despite 7.5% eurozone inflation. The ECB’s bond purchase program is expected to run until August, albeit at diminishing amounts. Rate hikes will only be considered after the bond exit. The Dollar Index has gained 2.1% in April and 3.9% since March 1.
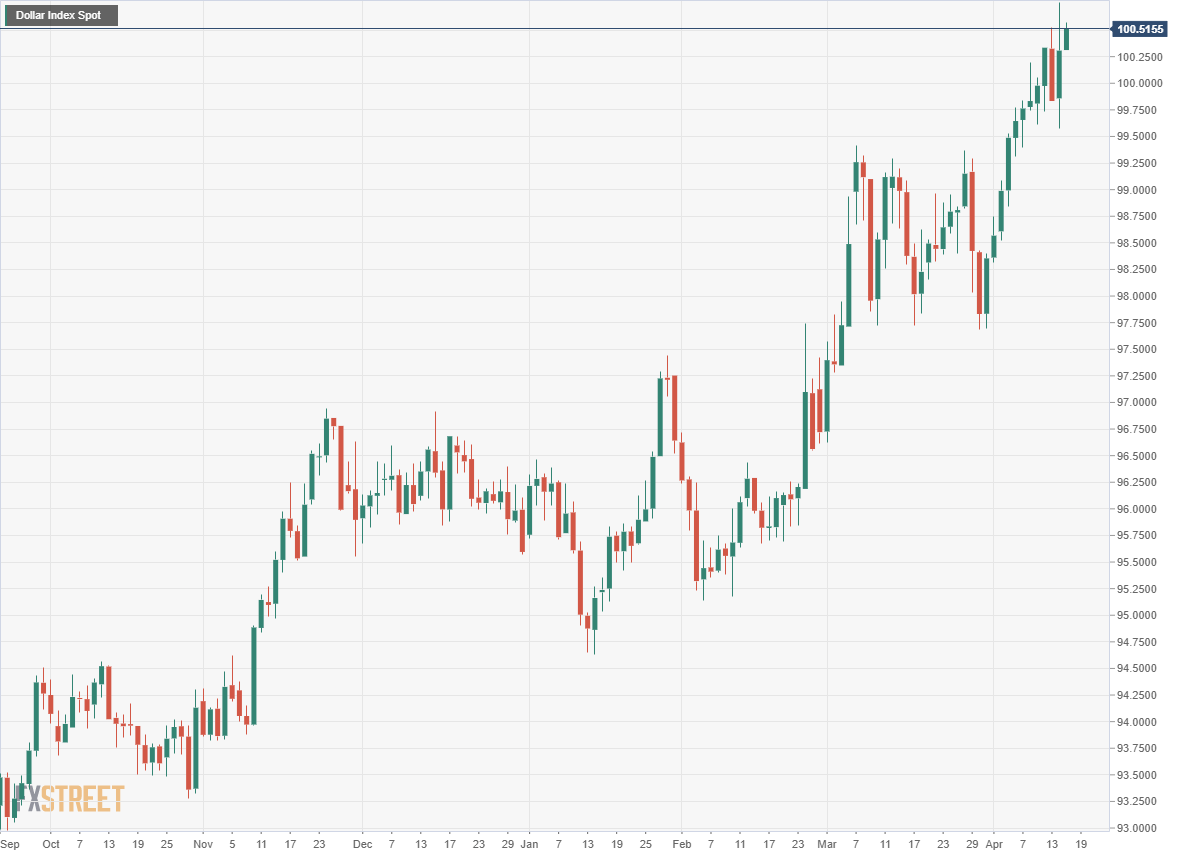
In the US, central bank rhetoric continued for a second week. New York Fed President John Williams said that a half-point hike at the May 4 meeting was a “very reasonable option” but that the pace of increases depends on the economy.
Treasury yields resumed their climb on Thursday after falling for two days. The 10-year rose 13.8 basis points to 2.827%, its highest since December 2018. It is now far above its immediate pre-pandemic return of around 1.6% in early February 2020. The 2-year gained 11.4 points to 2.456%. In February 2020 it was trading around 1.40%.
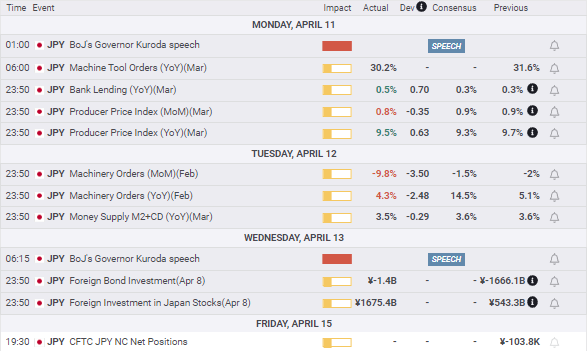
The Bank of Japan (BoJ) has noticed the rapid depreciation of the yen saying it is watching the market closely but with national CPI at 0.9% annually in February and core at -1%, it is not about to intervene in the currency markets.
Japanese producer prices rose 9.5% annually in March down slightly from February’s 9.7% pace but above the 9.3% forecast. For the month the Producer Price Index (PPI) added 0.8% after February’s 0.9% rise.
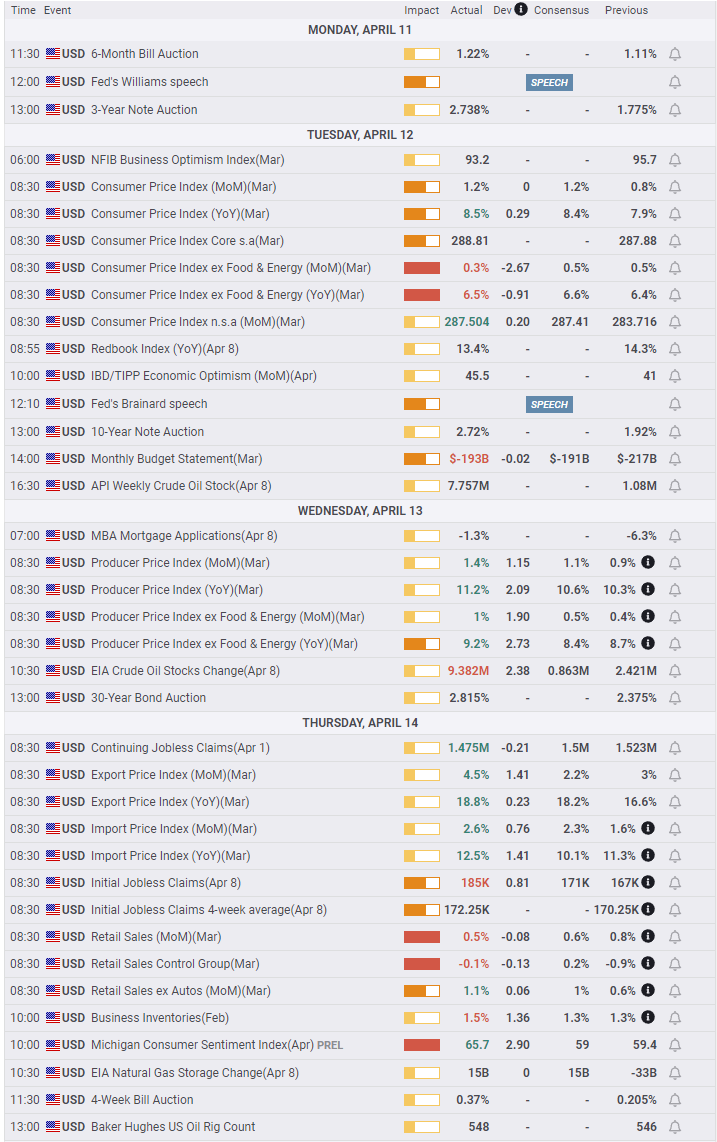
In the US, annual CPI set another four-decade record at 8.5% in March, up from 7.9% prior. Core prices rose 6.5%, 0.1% less than predicted but up from 6.4% in February. The Producer Price Index (PPI) climbed 1.4% for the month in March and 11.2% annually, both all-time records. Core PPI climbed 1% and 9.2% in March.
There was some market commentary that the 0.3% monthly increase in CPI, less than the 0.5% forecast and February's rate, was evidence that inflation had peaked. While that is possible, the continuing sharp gains in PPI, which will inevitably be transferred to consumer prices, make it dubious.
Retail Sales in the US were a bit weaker than expected in March but hefty upward revisions to February’s totals more than redressed the losses. The Control Group category which imitates the consumption contribution to GDP, fell 0.1% on a 0.2% forecast. Even so, the Atlanta Fed GDPNow model for first quarter growth remained at 1.1%.
Michigan Consumer Sentiment rose for the first time in four months in April.
USD/JPY Outlook
Having had its most successful six-weeks since the fall of 2016, the USD/JPY has, for the moment, few fundamental restraints. The move above 126.00 has brought the pair to a level not visited since June 2002.
Central bank policy divergence is the primary logic fueling the USD/JPY rise, but the ECB’s caution has provided a broad general assist to the greenback. The BoJ has been struggling with deflation for twenty years and more and while the rapid decline of the yen may be unsettling to Japan’s policymakers, it is also a useful, if involuntary, tool.
The main potential constraint on the USD/JPY is the prognosis for US interest rates. The 10-year yield is now within about 30 basis points of its 2018-2019 high and well within the historical range of the last decade. Can the US economy withstand another 50 points or more of yield curve rise without serious economic impact? Markets have not considered the issue in the belated rush to counter inflation, but with US economic growth around 1%, it will soon become a topic.
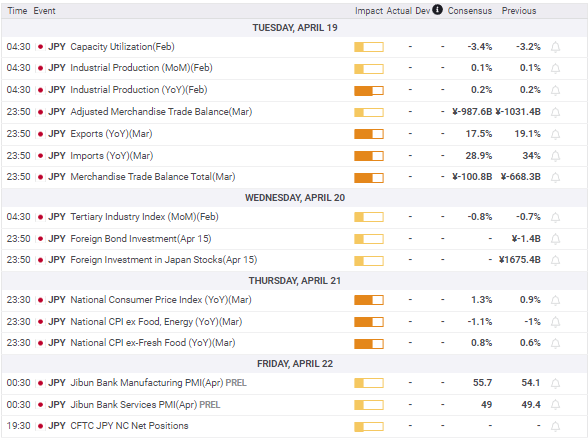
Japan's National CPI for March is expected to come in at 1.3%, up from 0.9% in February but core is forecast to dip to -1.1% from -1.0%. Whatever the result it will have no impact on BoJ policy.
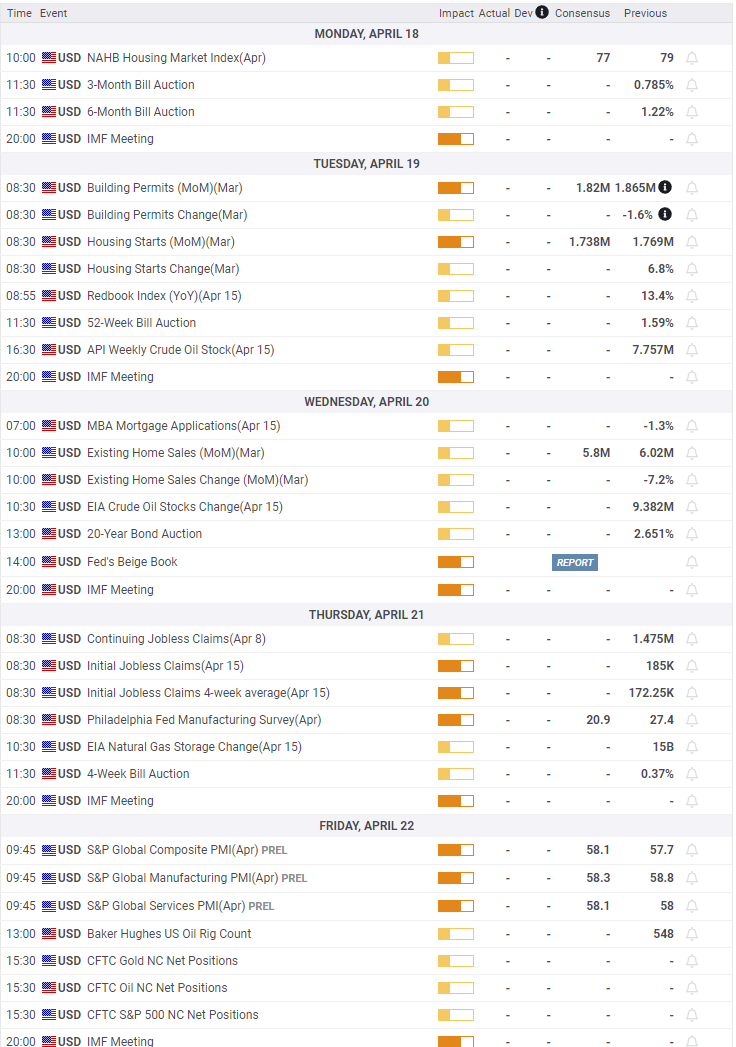
The Fed's Beige Book preparation for the May 4 meeting will convey its anecdotal analysis of the US economy but with policy already decided it's addition is a bit quaint. Existing Home Sales for March, about 90% of the US market, should begin to show the drag of higher mortgage rates.
The USD/JPY outlook is, for the moment, higher.
Japan statistics April 11–April 15
US statistics April 11–April 15

Japan statistics April 18–April 22
FXStreet
US statistics April 18–April 22
FXStreet
USD/JPY technical outlook
Technical indicators remain strongly positive. The MACD (Moving Average Convergence Divergence) added slightly to its five-year high. The Relative Strength Index (RSI) extended its stay in overbought territory to its longest period in a year. Average True Range (ATR) remained at its highest level since the collapse and recovery of the USD/JPY around the beginning of the pandemic in March 2020. The USD/JPY strength depends almost exclusively on the US-Japan rate divergence. Were that to change, these technical factors would quickly revert to their more traditional role, as warnings that the USD/JPY is overbought.
 tech 1-637856352900829200.png)
The nearest historical references for support levels are from May 2015 to December 2016, making them mere signposts rather than indicators of substantial trading interest. Of more import are the Fibonacci levels of the rise from March 7 to the current market. The extreme rapidity of the six-week ascent makes it susceptible to profit-taking if and when its fundamental bias begins to weaken. The 23.6% level at 123.63 and the 38.2% level at 121.94 are the main points for consideration. Historical resistance levels are even more distant, relating to the January to June 2002 run from 126.00 to 135.00 and back and have no meaningful reference for trading. In the current configuration resistance can be assumed at the traditional round numbers of 127.00, 127.50 and 128.00.
 tech 2-637856385982442689.png)
Moving Averages: 21-day 123.09, 50-day 118.89, 100-day 116.63, 200-day 114.08
Resistance: 127.00, 127.50, 128.00
Support: 125.35, 124.35, 124.00, 122.80, 122.00
FXStreet Forecast Poll
The bearish prediction in the FXStreet Forecast Poll is a natural reaction to the extreme rise in USD/JPY but it does not fully account for the equally extreme fundamental upward bias.
Author

Joseph Trevisani
FXStreet
Joseph Trevisani began his thirty-year career in the financial markets at Credit Suisse in New York and Singapore where he worked for 12 years as an interbank currency trader and trading desk manager.