USD/JPY: Upside breakout needed to push the price towards North

USDJPY has been bullish after producing a Double Bottom on the daily chart. The price took time to breach the neckline. Once the neckline got breached, the price has been heading towards the North with good buying pressure. All the daily candles have been bullish after the neckline breakout until the price had a rejection at a resistance level on last Thursday.
Let us have a look at the USD/JPY daily chart
Chart 1 USD/JPY Daily Chart
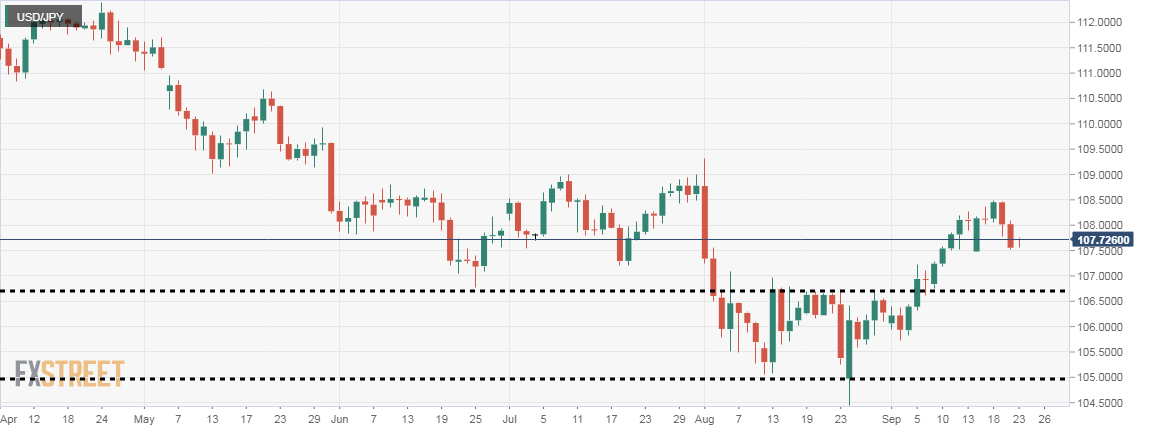
The price had a bounce twice at the level of 105.0000. Then, it had a rejection at the neckline resistance. After having a consolidation, it eventually made a breakout; confirmed it and headed towards the North. Three of those daily candles came out as Doji candles. Rest of them came out as strong bullish candles. However, last Thursday’s and Friday’s candles came out as bearish candles to make a downside correction. The price may make a daily bullish reversal candle around the area where it is now.
Let us have a look at the daily chart again
Chart 2 USD/JPY Daily Chart
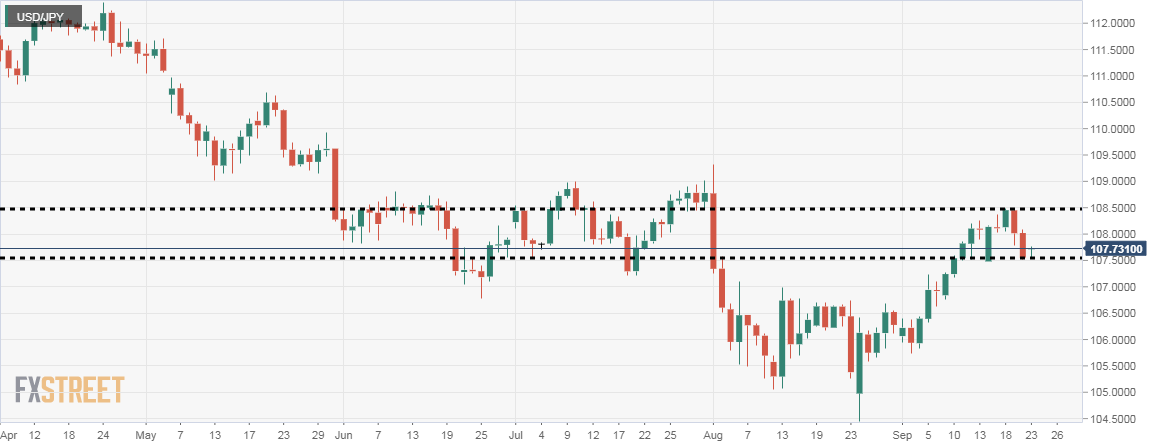
The price found its resistance at the level of 108.5000. The level of 107.5000 may act as the level of support since this is a Fibonacci level, as well as the price had reacted around this level earlier. If the level is held and it produces a daily bullish reversal candle, an intraday breakout at the highest high (108.5000) of the wave may attract the buyers to go long on the pair.
Let us find out how the H4 chart looks like
Chart 3 USD/JPY H4 Chart
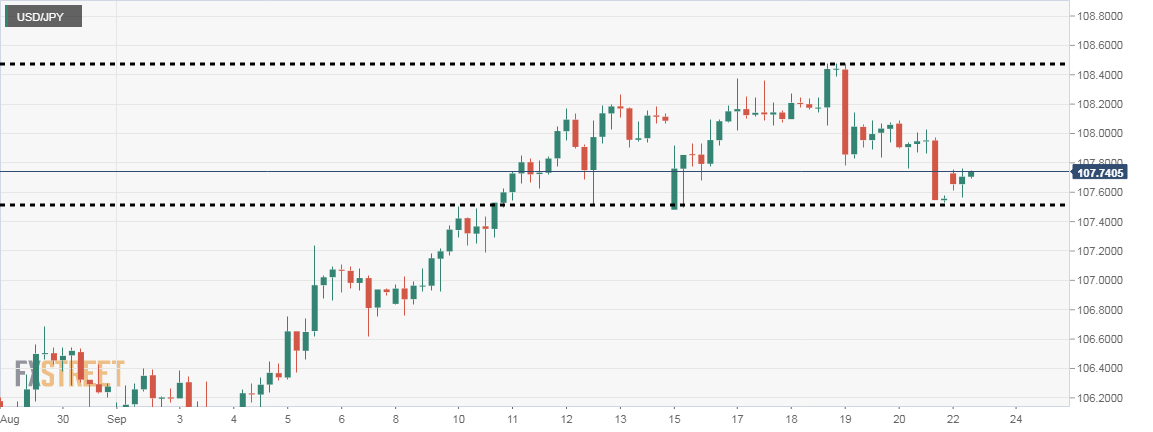
The H4 chart price action suggests that the price may have found a level of support at 107.5075. The level seems to be a Double Bottom’s resistance as well. If the price continues to go towards the North and makes a breakout at the resistance, it may head towards the North with more buying pressure. The price has a lot of space to travel towards the North. It may find its resistance at the level of 109.4220 next.
The daily chart is having a downward correction, but the H4 chart is a little biased with the bear. However, as long as the support level is held, H4 buyers shall be optimistic. This means all eyes are on the support level. Sellers would love to see a downside breakout at the level. On the other hand, buyers would love to see the level is held and a bullish daily reversal candle. Let us wait and see how the drama ends.
Author

EagleFX Team
EagleFX
EagleFX Team is an international group of market analysts with skills in fundamental and technical analysis, applying several methods to assess the state and likelihood of price movements on Forex, Commodities, Indices, Metals and


