USD/JPY technical outlook: Elliott Wave analysis points to bearish opportunity after corrective rally [Video]
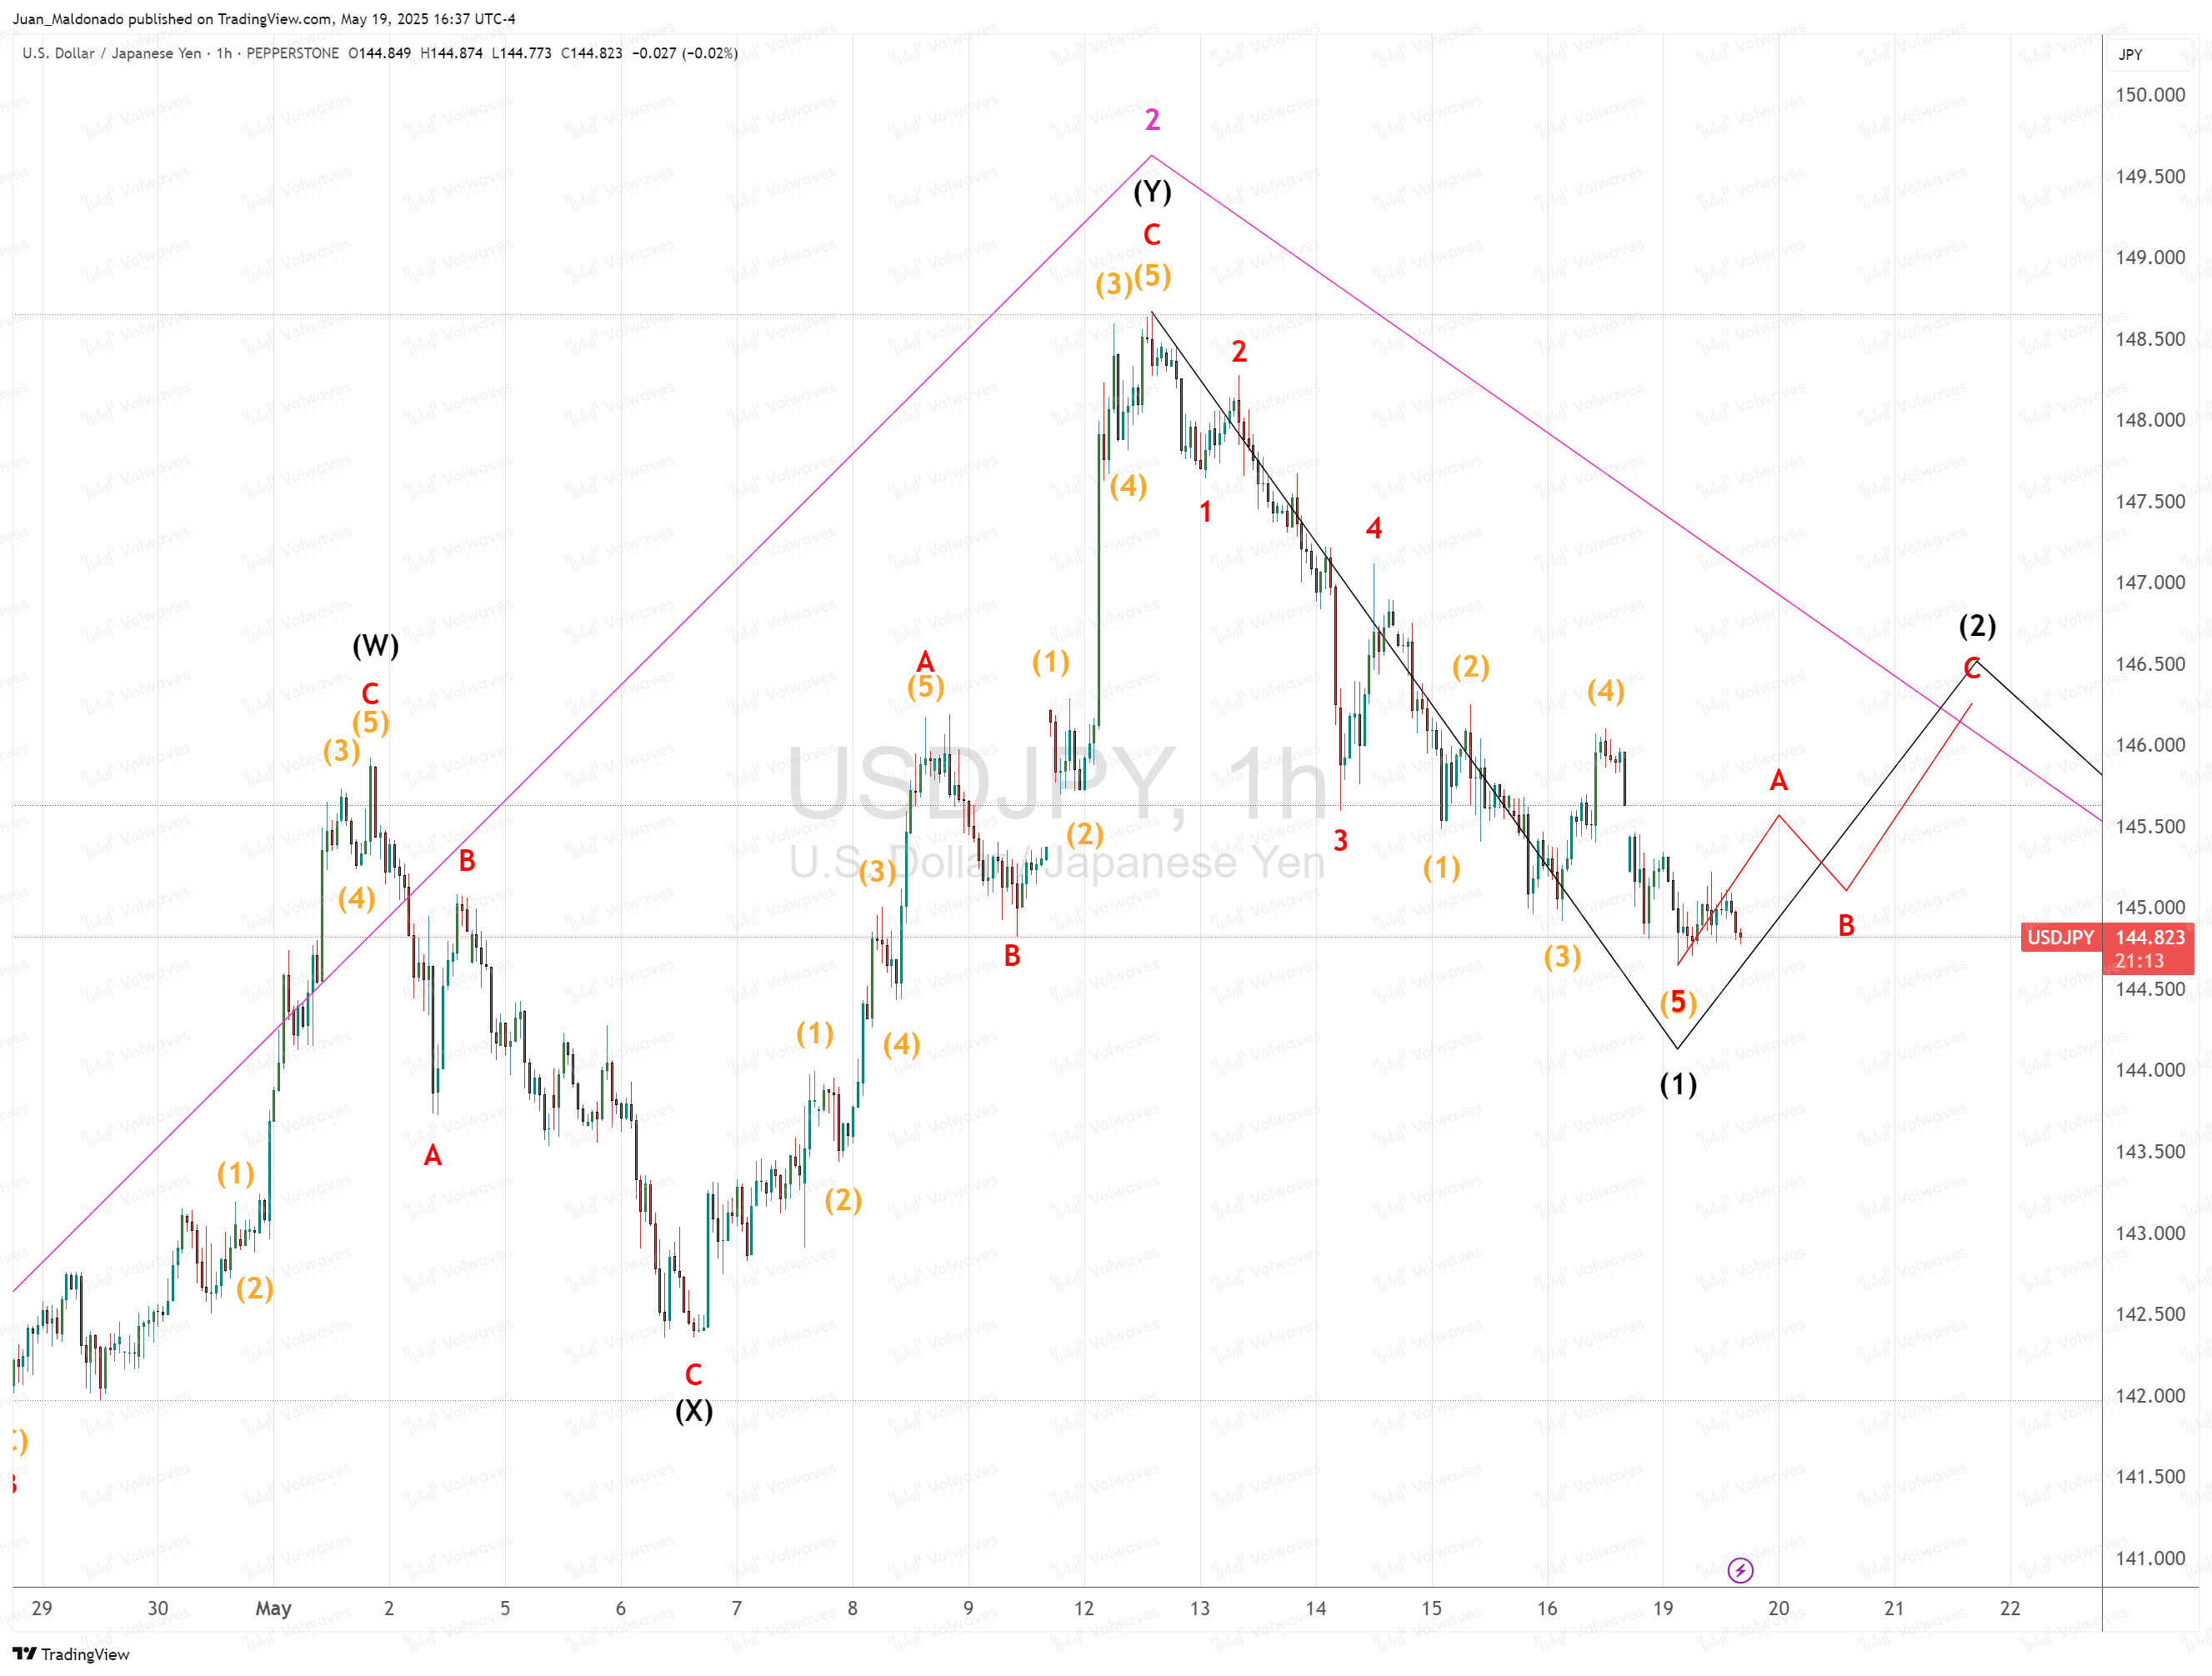
This week, USDJPY stands out as one of our favorite instruments to trade. Based on the current Elliott Wave structure, the pair has completed a clean five-wave decline labeled as wave (1), and is now developing a corrective rally that should complete wave (2) before resuming its bearish trend.
Elliott Wave count breakdown
Looking at the left side of the chart, we can see a completed double three corrective structure labeled W-X-Y. Wave (W) finished with a classic A-B-C pattern, followed by a brief X correction, and then another A-B-C structure forming wave (Y). This entire sequence concluded at the pink wave 2 high, which marks the end of the correction and the beginning of a new impulsive wave down.
The decline that follows is labeled as wave (1), and consists of a textbook five-wave impulsive move:
-
Wave 1: Initial strong sell-off
-
Wave 2: Shallow corrective bounce
-
Wave 3: Extended and directional drop
-
Wave 4: Lateral correction
-
Wave 5: Final leg down completing the sequence
This structure strongly suggests the beginning of a larger bearish cycle, and now we’re seeing a retracement that fits as a developing wave (2) correction.
Trading strategy
At the moment, the market is forming what appears to be a zigzag A-B-C corrective pattern in red. Here's how we expect the next moves to unfold:
-
Wave A is already underway, pushing the price higher.
-
Wave B should follow with a temporary dip.
-
Wave C is expected to complete the correction toward the 145.80–146.30 zone.
Once wave (2) completes, we’re preparing to enter short positions in anticipation of the next impulsive move down — wave (3), which typically is the strongest and longest wave in an impulsive sequence.
Key levels and risk management
The invalidation point for this bearish scenario is above the high of wave (1), around 147.75. As long as price remains below this level, the bearish outlook remains valid.
The ideal short entry zone lies in the 145.80–146.30 region, where the end of wave C would likely align with the projected wave structure and the diagonal pink guideline from previous highs. In this area, we’ll be watching for bearish reversal signals to trigger trades with a favorable risk-reward setup.
Final thoughts
USDJPY is offering a clear technical setup this week through the lens of Elliott Wave theory. With wave (1) completed and wave (2) now in progress, we’re preparing to take advantage of the upcoming bearish leg — wave (3).
This kind of setup provides high probability trading opportunities, but timing is key. Let the correction complete, confirm the reversal, and execute with discipline.
Author

Juan Maldonado
Elliott Wave Street
Juan Maldonado has a University degree in Finance, and Foreign trade started his trading career in 2008. Since 2010 has been analyzing the markets using Elliott Wave with different strategies to spot high probability trades.


