Technical analysis: Will the USD/JPY price retreating continue?

USD/JPY technical analysis summary
Sell Stop: Below 112.67.
Stop Loss: Above 113.73.
| Indicator | Signal |
| RSI | Neutral |
| MACD | Buy |
| Donchian Channel | Neutral |
| MA(200) | Sell |
| Fractals | Sell |
| Parabolic SAR | Sell |
USD/JPY chart analysis
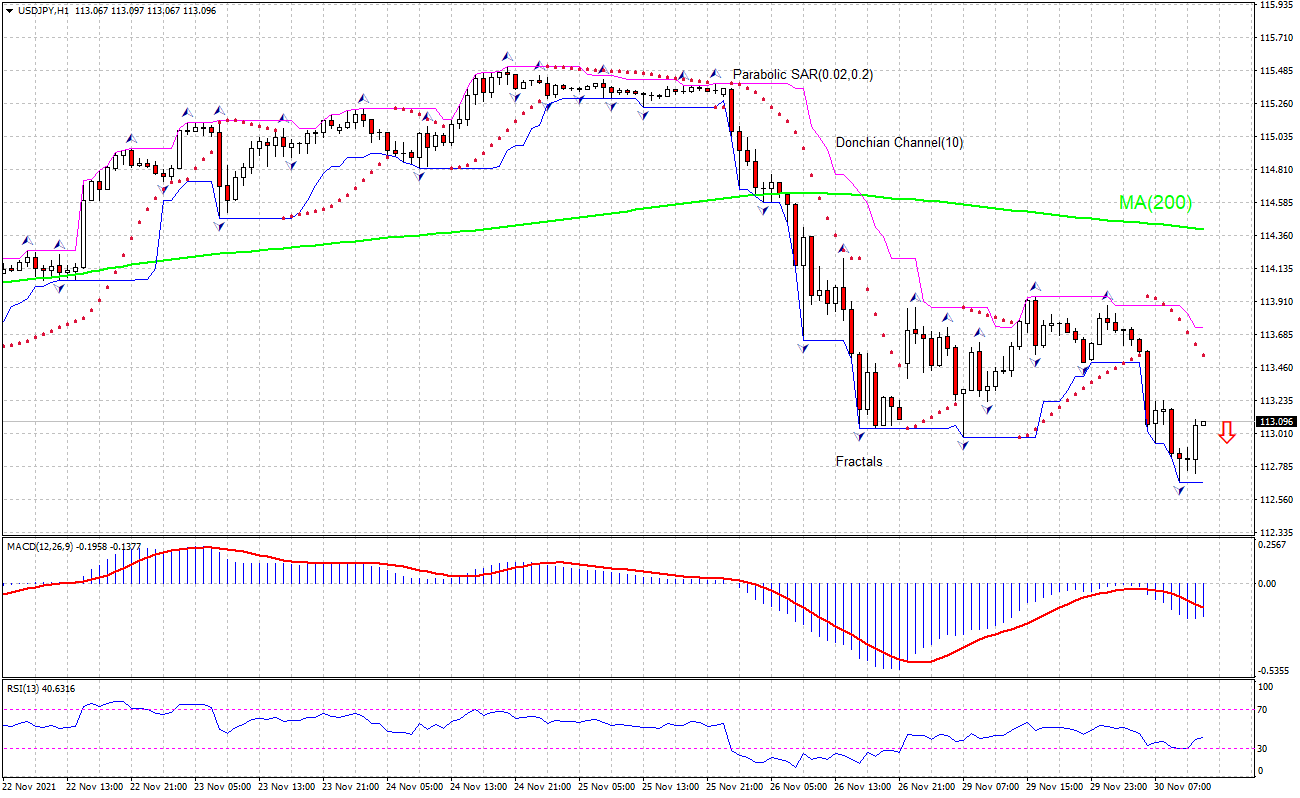
The technical analysis of the USDJPY price chart on 1-hour timeframe shows USDJPY: H1 is retracing down under the 200-period moving average MA(200) which is declining. We believe the bearish movement will continue after the price breaches below the lower bound of the Donchian channel at 112.67. A level below this can be used as an entry point for placing a pending order to sell. The stop loss can be placed above 113.73. After placing the order, the stop loss is to be moved to the next fractal high indicator, following Parabolic signals. Thus, we are changing the expected profit/loss ratio to the breakeven point. If the price meets the stop loss level without reaching the order, we recommend cancelling the order: the market has undergone internal changes which were not taken into account.
Fundamental Analysis of Forex - USD/JPY
Japan’s unemployment rate declined in October. Will the USDJPY price retreating continue?
Japan’s unemployment rate declined in October: the Statistics Bureau reported unemployment rate ticked down to 2.7% in October from 2.8% in September, when no change was forecast. This is bearish for USDJPY.
Want to get more free analytics? Open Demo Account now to get daily news and analytical materials.
Want to get more free analytics? Open Demo Account now to get daily news and analytical materials.
Author

Dmitry Lukashov
IFC Markets
Dimtry Lukashov is the senior analyst of IFC Markets. He started his professional career in the financial market as a trader interested in stocks and obligations.


