Technical analysis: Will the USD/JPY price rebound resume?

USD/JPY technical analysis summary
Buy Stop։ Above 114.01
Stop Loss։ Below 113.79
| Indicator | Signal |
| RSI | Neutral |
| MACD | Neutral |
| Donchian Channel | Buy |
| MA(200) | Buy |
| Fractals | Neutral |
| Parabolic SAR | Buy |
USD/JPY chart analysis
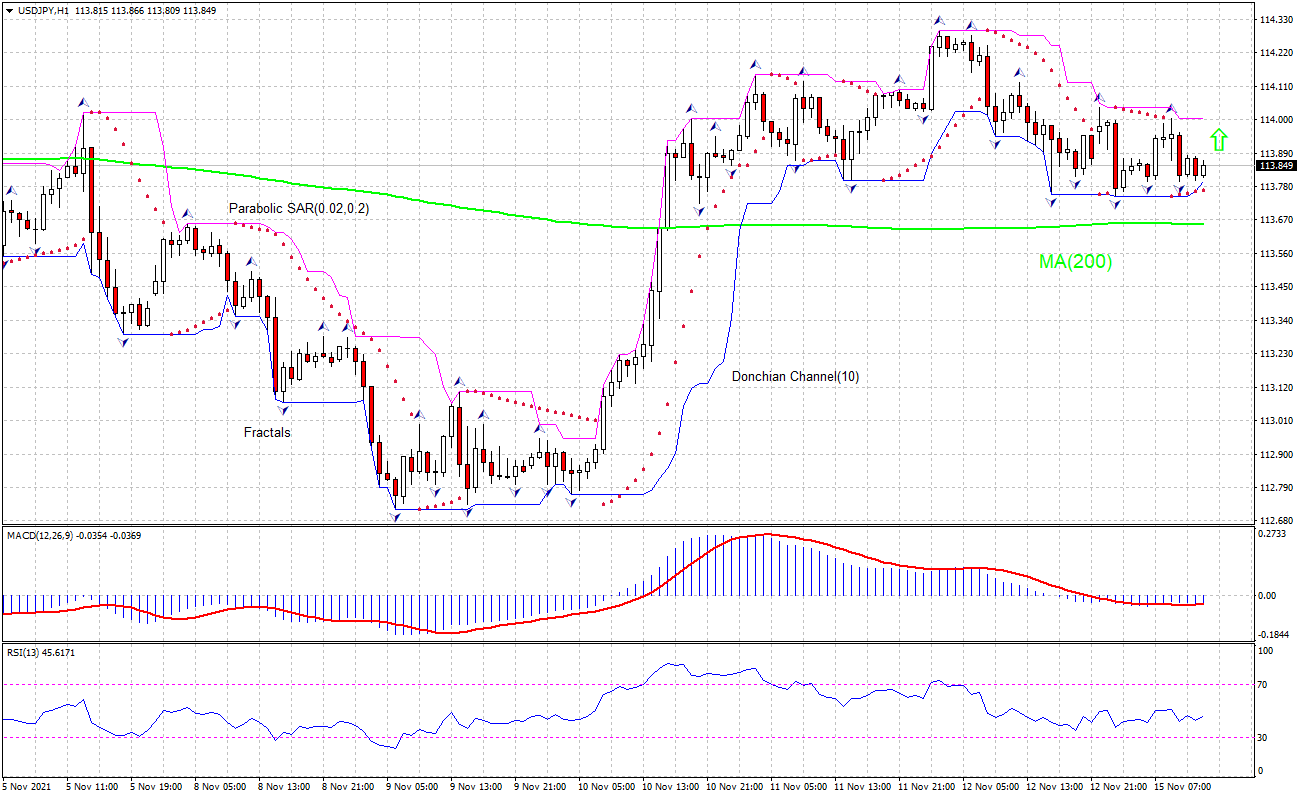
The technical analysis of the USDJPY price chart on 1-hour timeframe shows USDJPY: H1 is attempting to retrace up above the 200-period moving average MA(200). The price reversed its rising after hitting a weekly high a day ago. We believe the bullish movement will resume after the price breaches above the upper bound of the Donchian channel at 114.01. A level above this can be used as an entry point for placing a pending order to buy. The stop loss can be placed below 113.79. After placing the order, the stop loss is to be moved to the next fractal low indicator, following Parabolic signals. Thus, we are changing the expected profit/loss ratio to the breakeven point. If the price meets the stop loss level without reaching the order, we recommend cancelling the order: the market has undergone internal changes which were not taken into account.
Fundamental Analysis of Forex - USD/JPY
Japan’s economic contraction was bigger than expected in the third quarter. Will the USDJPY price rebound resume?
Japan’s economy contraction was bigger than expected in the third quarter: the Cabinet Office reported the Q3 gross domestic product (GDP) declined 0.8% over quarter following 0.5% growth in Q2, when an 0.2% decrease was forecast. This is bullish for USDJPY.
Want to get more free analytics? Open Demo Account now to get daily news and analytical materials.
Want to get more free analytics? Open Demo Account now to get daily news and analytical materials.
Author

Dmitry Lukashov
IFC Markets
Dimtry Lukashov is the senior analyst of IFC Markets. He started his professional career in the financial market as a trader interested in stocks and obligations.


