USD/JPY: Stocks plunge as gold, yen rally in 'risk off' trade
The signs were there for a stock market plunge, which is exactly what has happened today. Gold, a perceived safe-haven asset, had been rising strongly of late despite the dollar’s strength and the equity market rally. The Japanese yen, likewise another safe haven asset, has been firm and today it has got firmer. It looks like the equity market has finally got in sync with these markets. Indeed, risk was clearly off the menu at the time of this writing, with the FTSE and DAX indices trading near their lows and US index futures were pointing to a sharply lower open on Wall Street. Is this the start of the crash that many people had been waiting for? Well, that remains to be seen. In part, it depends on what Wall Street will do today. So far every dip – small or big – have been bought. But at these record high levels, there will be a lot of stop orders that had been accumulated during the melt up. I fear these stops may be tripped, triggering a sharper fall before we see a bounce.
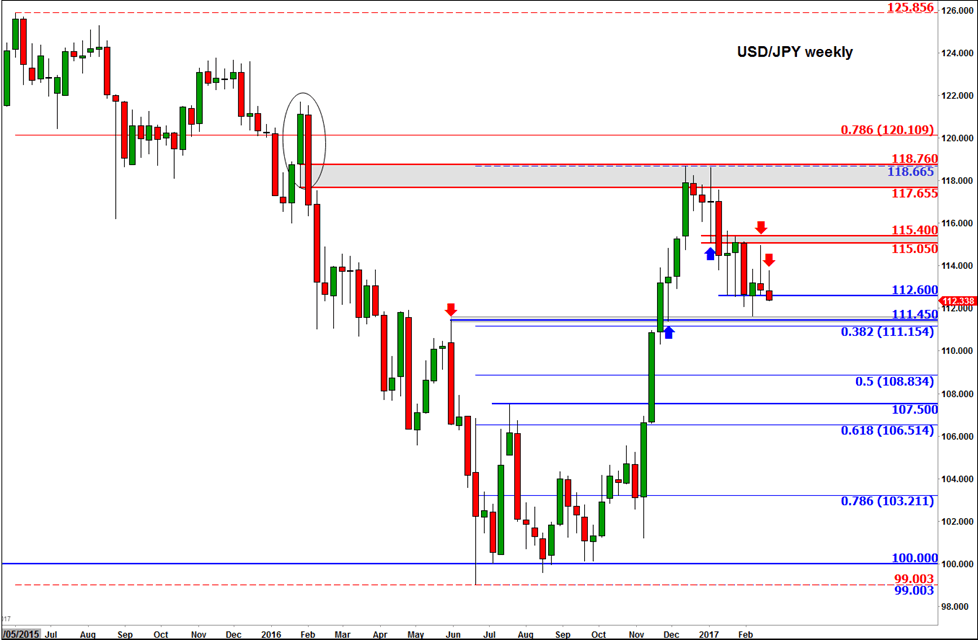
What this may mean for the USD/JPY is that we could see further declines if the sentiment does not improve quickly. Indeed, the weekly chart of the USD/JPY paints a rather bearish picture. Last week it had formed and inverted hammer as the 115.00 level held as resistance again. The advance from early this week has been pushed back and this week’s candlestick – which is yet compete of course – shows another bearish pattern. If the USD/JPY closes the week below the 112.60 support level then expect to see more losses in early next week. The next key support level is around 114.50 on the weekly time frame. This level had been support and resistance in the past and it comes in just ahead of the 38.2% Fibonacci retracement level at 111.15. Below these levels, the next significant support is at 107.50 – the last high pre breakout – followed by the 61.8% Fibonacci retracement level at 106.50. On this weekly time frame, the bias would turn back bullish if and when it climbs above 115.00/40 again. Either that or we see some other bullish reversal signs first.
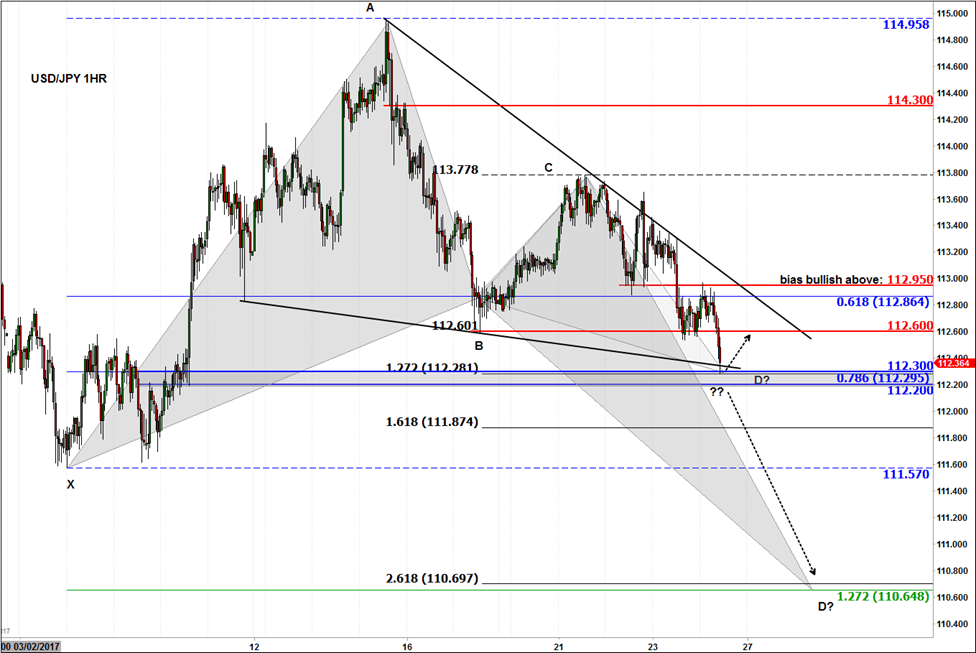
Meanwhile on the short-term time frame, there is a possibility we may see a bounce at 112.20/30 area, which was being tested at the time of this writing. As can be seen on the hourly chart, in figure 2, this is where horizontal support meets two Fibonacci levels – the 78.6% retracement of the XA swing and 127.2% extension of the BC swing. This area therefore markets the point D of a bullish Gartley pattern. Given the higher time frame bearish view, the bulls would do very well to hold their ground here at 112.20/30. We could nonetheless see a bounce here, to at least 112.60 resistance before the downward trend probably resumes. But if we start to move below 112.20 support then the next stop for the USD/JPY on the hourly time frame could be at the prior support level of 111.57 (i.e. point x), or lower still at 110.65/75, which is another area where two Fibonacci extension levels of the above price swings converge. This makes 110.65/75 the point D of a Bullish Butterfly pattern. So we could see a bounce should we get there, in part because of profit-taking from the shorts. Meanwhile if the 112.95 resistance level breaks then this would end the short-term bearish bias.
Author

Fawad Razaqzada
TradingCandles.com
Experience Fawad is an experienced analyst and economist having been involved in the financial markets since 2010 working for leading global FX, CFD and Spread Betting brokerages, most recently at FOREX.com and City Index.


