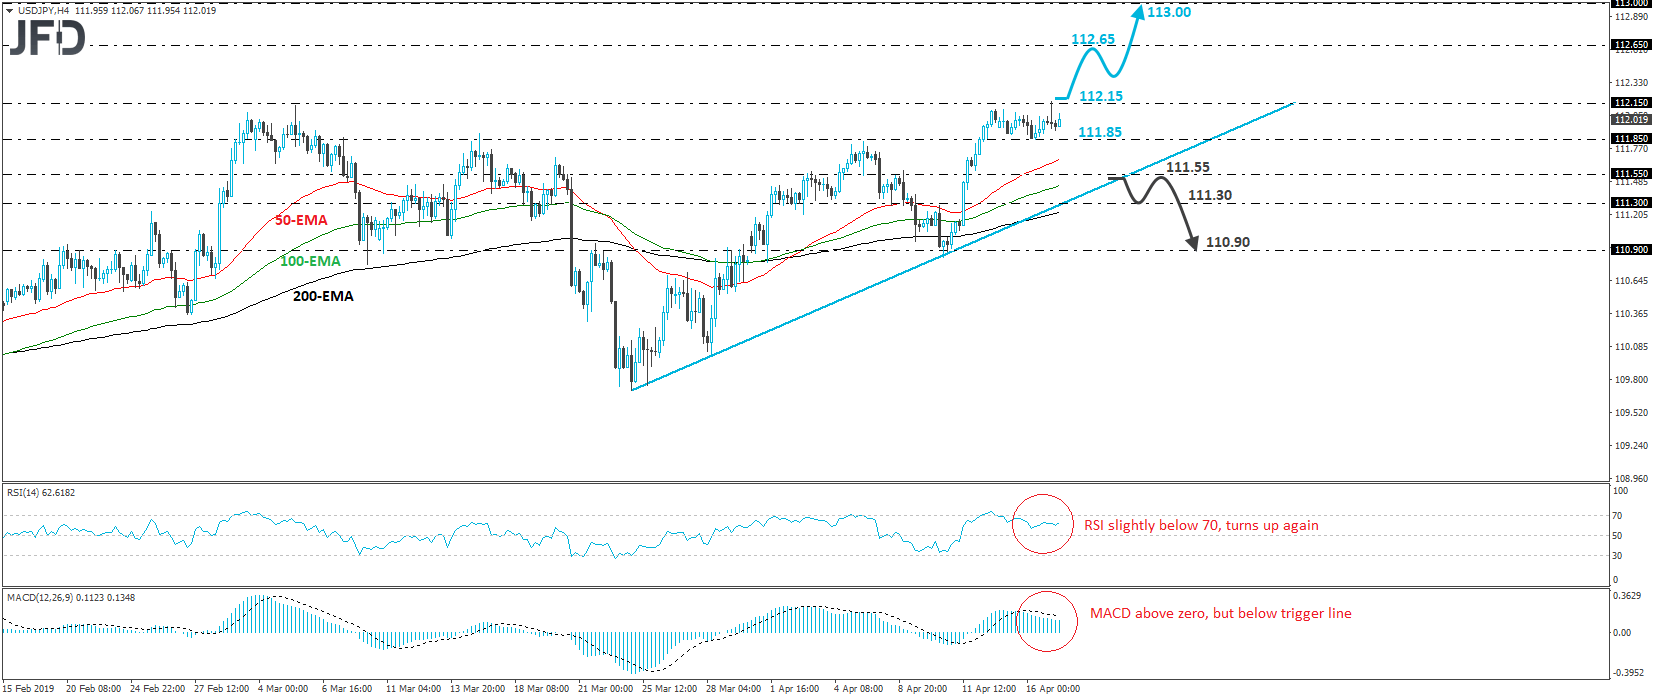
USD/JPY Oscillates Between 111.85 and 112.15

USD/JPY edged north on Friday, breaking above the key resistance (now turned into support) hurdle at 111.85. That said, this week, the rate has entered a sideways mode, oscillating between that barrier and the resistance of 112.15. Overall, the rate continues to trade above the upside support line drawn from the low of March 25th and thus, we see decent chances for the bulls to wake up again an drive the action higher.
A clear break above the 112.15 zone would confirm a forthcoming higher high on the 4-hour chart and may pave the way towards our next key obstacle, at around 112.65. That level provided decent resistance to the rate between December 18th and 20th. If, this time, there is appetite among the bulls to push through that zone, then we may see the advance extending towards the 113.00 area, marked by the inside swing low of December 11th.
Shifting attention to our short-term oscillators, we see that the RSI lies slightly below its 70 line and has just turned up again. However, the MACD, although positive, remains below its trigger line. This make us cautious that a corrective retreat may be on the cards before, and if, the bulls decide to take charge again. A dip below 111.85 may confirm the case of a setback and may allow declines towards the crossroads of the 111.55 level and the aforementioned upside line.
Having said all that though, in order to start examining whether the bulls have abandoned the battlefield, we would like to see a decisive dip below the 111.50 and the upside line. Such a break may initially set the stage for the 111.30 support hurdle, the break of which may carry larger bearish implications, perhaps paving the way towards the 110.90 zone, slightly above the lows of April 1st and 10th.
JFDBANK.com - One-stop Multi-asset Experience for Trading and Investment Services
Author

JFD Team
JFD


