|

USD/JPY on the rise: Is the rally sustainable?

  • USD/JPY starts a new bullish cycle ahead of US CPI data.

  • Key resistance near 154.30. Will the bulls retain their power?

usdjpy

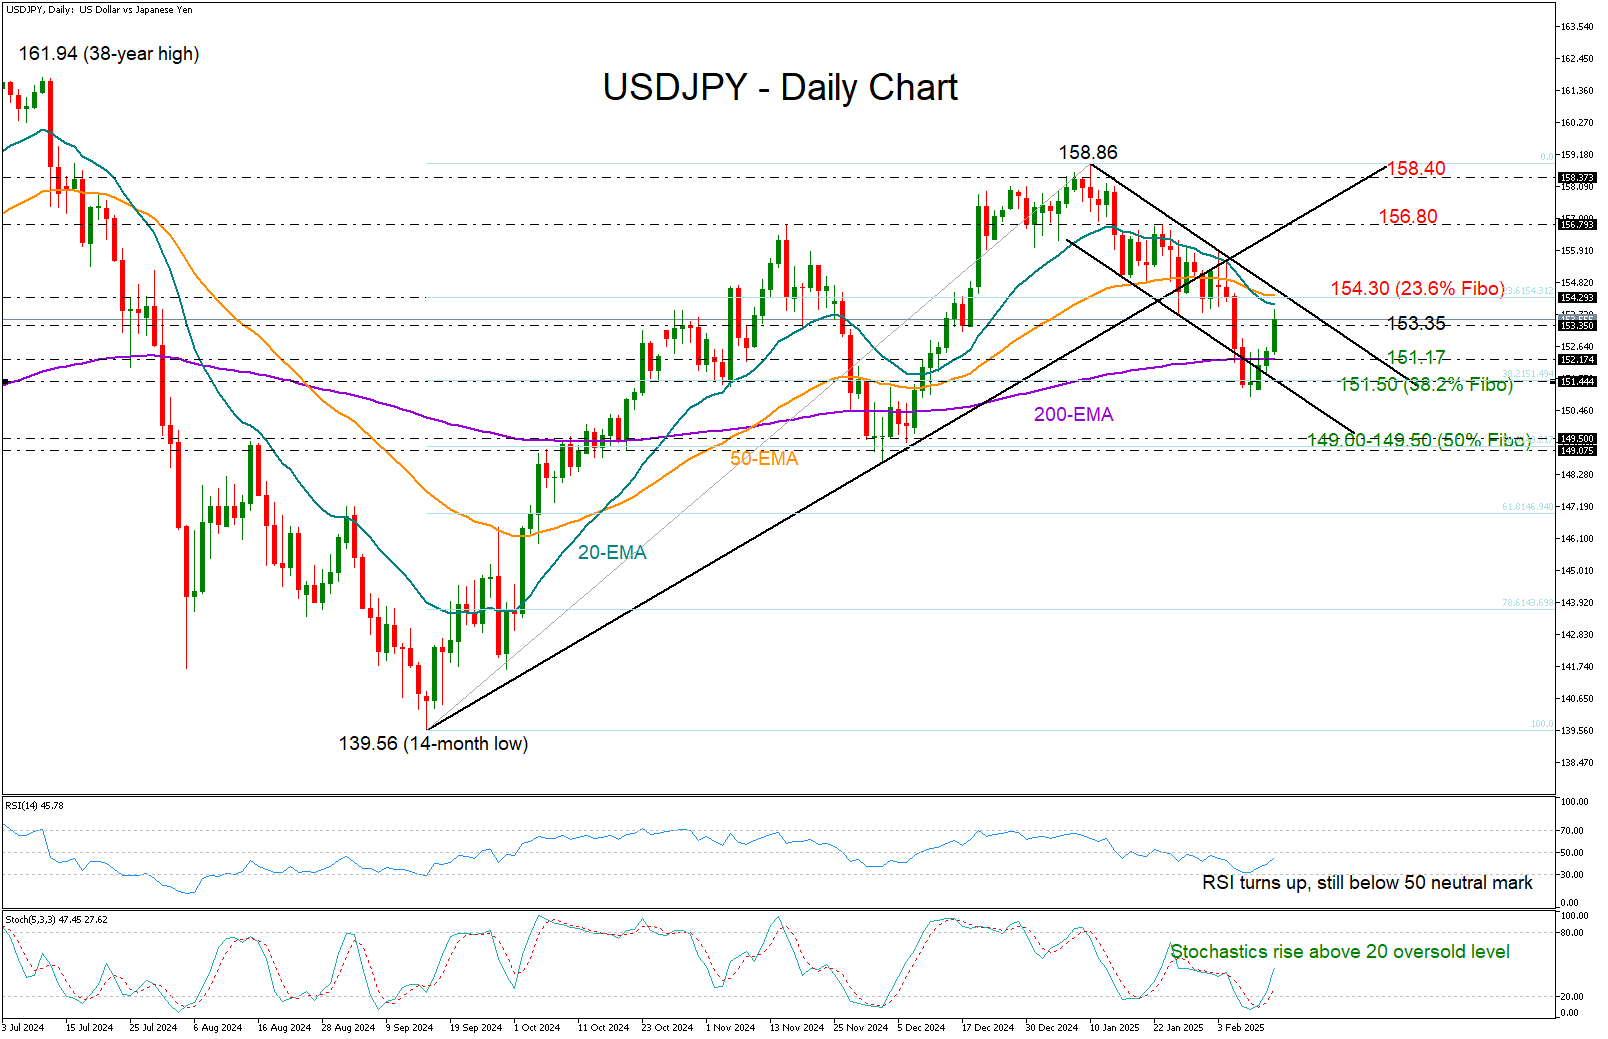
USDJPY drifted up to 153.72 after confirming a bullish morning star candlestick pattern above its constraining 200-day exponential moving average (EMA). This marks the start of a potential new bullish cycle—at least for now.

The positive reversal in the RSI and the stochastic oscillator is reflecting improving buying appetite, though the former is still some distance below its 50 neutral mark, suggesting the market is still waiting for confirmation

Perhaps, some patience is necessary until the price clears the crucial resistance of 154.30. This is where the 23.6% Fibonacci retracement of the September-January upleg, the upper band of short-term bearish channel, as well as the 20- and 50-day EMAs are sitting. If the pair can break through this wall, a faster rally could follow towards the 156.80 region, while higher the focus could turn to the 158.40 barrier.

Yet, the bearish cross between the 20- and 50-day EMAs is casting doubt about whether the pair will return to an uptrend soon, particularly if it fails to close above 153.35. In this case, the price could flip backwards to retest the flat 200-day EMA near 151.17 and the 38.2% Fibonacci of 151.50. Additional losses from there could set the stage for a deeper pullback into the 149.00-149.50 territory, where the 50% Fibonacci number lurks.

In summary, USDJPY is enjoying some recovery at the moment, though it's not out of the woods yet. A decisive break above 154.30 would likely eliminate downside risks, but until then, traders may stay on their toes. 

Author

Christina Parthenidou

Christina joined the XM investment research department in May 2017. She holds a master degree in Economics and Business from the Erasmus University Rotterdam with a specialization in International economics.

More from Christina Parthenidou
Share:

Markets move fast. We move first.

Orange Juice Newsletter brings you expert driven insights - not headlines. Every day on your inbox.

By subscribing you agree to our Terms and conditions.

Editor's Picks

EUR/USD trades around 1.1700 after rebounding from 50-day EMA

EUR/USD gains ground after three days of losses, trading around 1.1700 during the Asian hours on Wednesday. On the daily chart, technical analysis indicates a potential for a bearish bias; the 14-day Relative Strength Index at 47 confirms waning momentum.

GBP/USD climbs above 1.3500 as US Dollar weakens ahead of ISM Services PMI

GBP/USD gains some ground after registering modest gains in the previous session, trading around 1.3510 during the Asian hours on Wednesday. The pair edges higher as the US Dollar struggles ahead of the US ISM Services Purchasing Managers’ Index and JOLTs job openings due later in the day.

Gold pulls back from $4,500 amid profit-taking ahead of key US macro data

Gold struggles to capitalize on its strong weekly gains registered over the past two days and faces rejection near the $4,500 psychological mark, or over a one-week high touched during the Asian session on Wednesday. As investors digest the recent US attack on Venezuela, the prevalent risk-on environment prompts some profit-taking around the commodity. 

Bitcoin, Ethereum and Ripple cool off as rally stalls near key resistance zones

Bitcoin, Ethereum, and Ripple prices are taking a breather on Wednesday near their key resistance levels following the recent surge. BTC faces rejection at the $94,253 level, while ETH and XRP follow BTC’s footsteps, struggling near $3,308 and $2.35, respectively.

Implications of US intervention in Venezuela

Events in Venezuela are top of mind for market participants, and while developments are associated with an elevated degree of uncertainty, we are not making any changes to our markets or economic forecasts as a result of the deposition of Nicolás Maduro. 

Aave Price Forecast: AAVE eyes bullish breakout as on-chain and derivatives data turns supportive

Aave (AAVE) price hovers around $172 on Wednesday, nearing the upper trendline of the falling parallel channel pattern. A break above this technical pattern favors the bulls.