USD/JPY Looks Ready for a Pickup in Volatility

Over the last two days the FX markets have been fairly quiet as they wait for the next catalyst to offer some direction. However, it's not just been the last two days that volatility has slowed! My colleague Ken provided me with a chart showing just how slow volatility has become over the last few months. The chart below shows USD/JPY 1 Month ATM implied vol rebased over year to date. In other words, the chart shows a decrease of volatility of roughly 40% since mid-August in USD/JPY. (Notice at the far right it has turned up recently.)
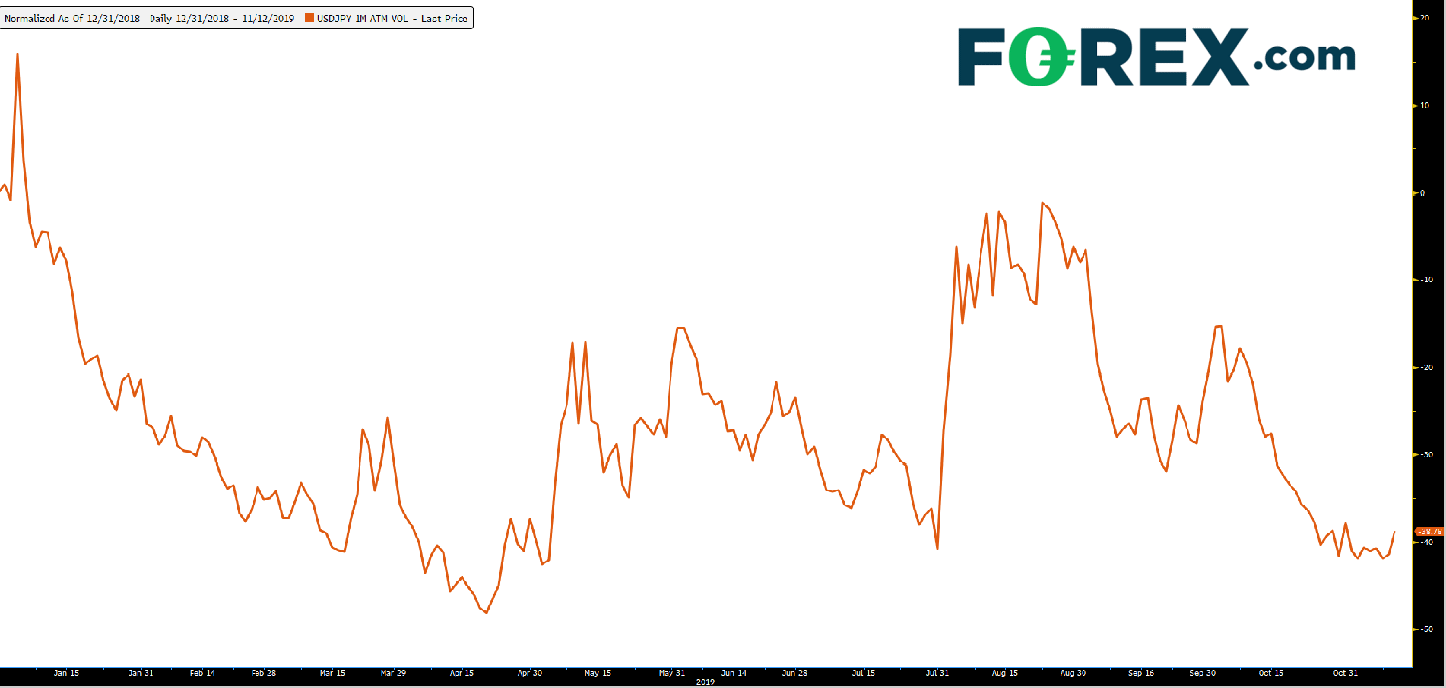
Source: Bloomberg, FOREX.com
What could that next catalyst be for the markets? At 12:00pm EST, President Trump is set to speak at the New York Economic Club. One can imagine how upbeat he may be on the economy and although he is not expected to offer any new policies, the markets need to expect the unexpected from the "stock market friendly" President. Tomorrow the US also offers the October look at CPI and Fed Chairman Powell is set to testify on the economic outlook and recent monetary policy actions before the Joint Economic Committee. Hopefully one of these events will give us some volatility to trade.
What could some volatility do to USD/JPY? Many market participants are looking at the inverted head and shoulders pattern on a daily timeframe. The exact placement of the neckline is debatable; however it appears that if price breaks through the neckline near current levels, the target would be near 114.00. (A catalyst for a move such as this would be stock positive.) There is plenty of resistance though that USD/JPY would need to break through to reach the target, including the 61.8% retracement from the high on April 24th to the low on August 26th at 109.36, the gap fill from early May near 111.10, and the April 24th highs at 112.40.
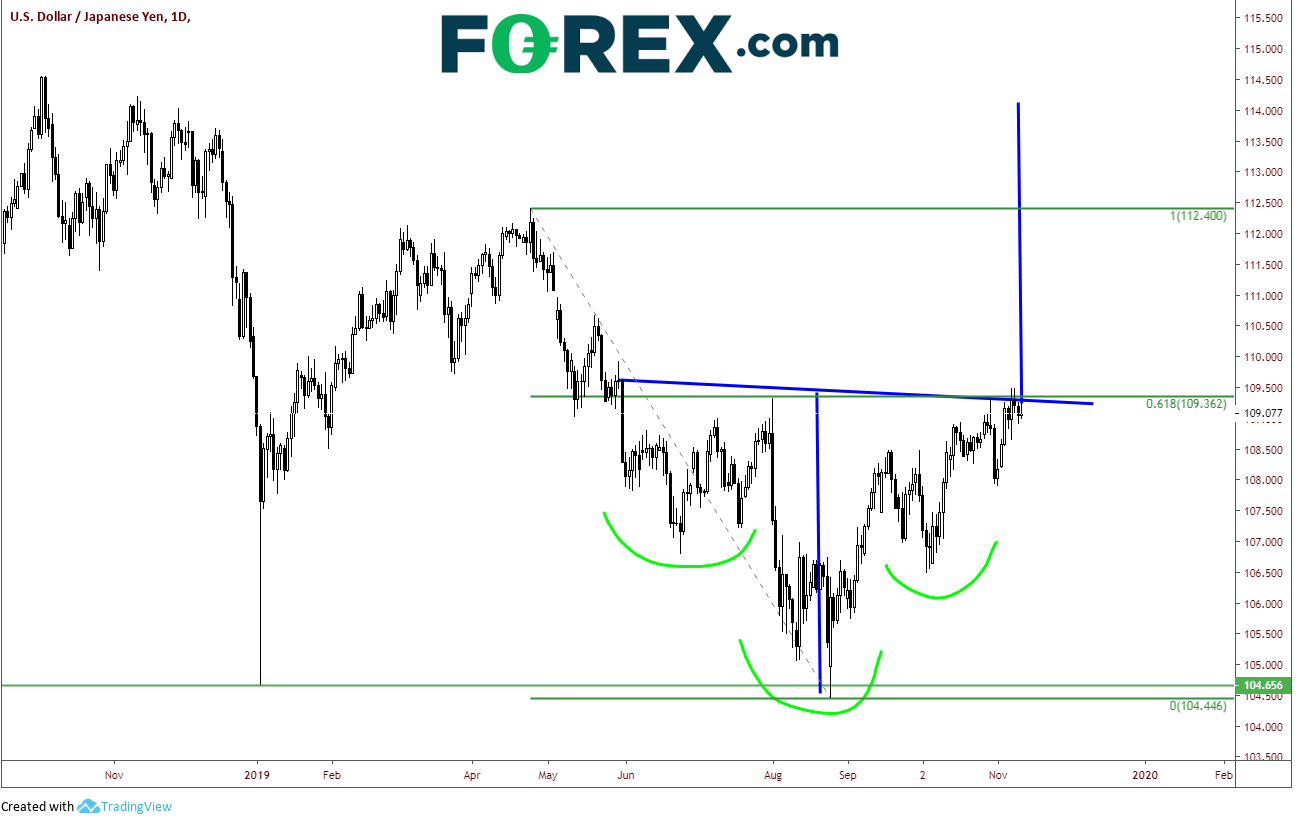
Source: Tradingview, FOREX.com
However, on a shorter 240-minute timeframe, is appears that price may have broken lower out of a rising wedge. If that is the case, the target for the breakdown of a rising wedge is a 100% retracement of the wedge, which is near 108.00 (A catalyst for a move such as this would be stock negative.) That level also coincides with the 50% retracement from the October 3rd lows to the 109.50 highs reached multiple times earlier this month. There is horizonal support lower near 108.50 and the 38.2% retracement of the previously mentioned timeframe at 108.34.
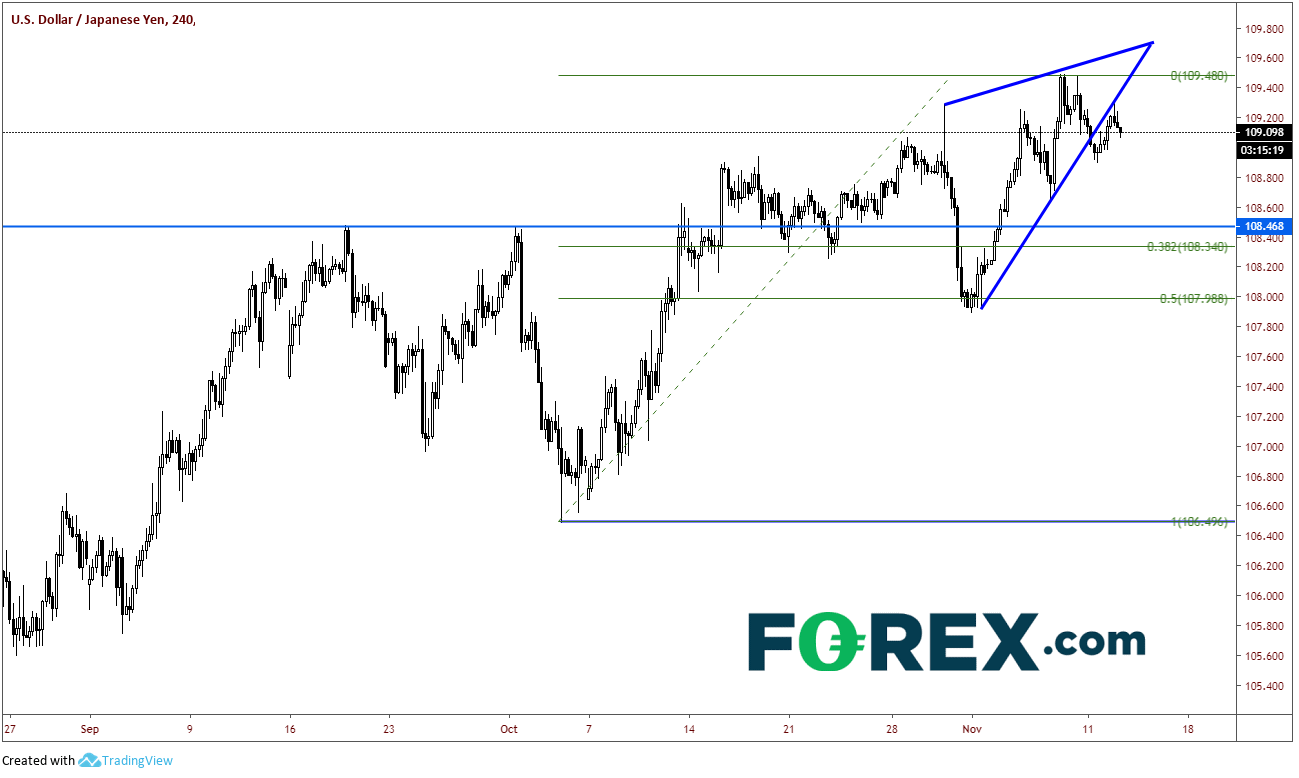
Source: Tradingview, FOREX.com
Depending on your trading style and timeframe, with proper risk management, USD/JPY can be traded on either side of the market. However, the one thing we clearly need is volatility!
Author

Forex.com Team
Forex.com


