USD/JPY Indecision Zone Prepares for Volatile Breakout

Hi traders,
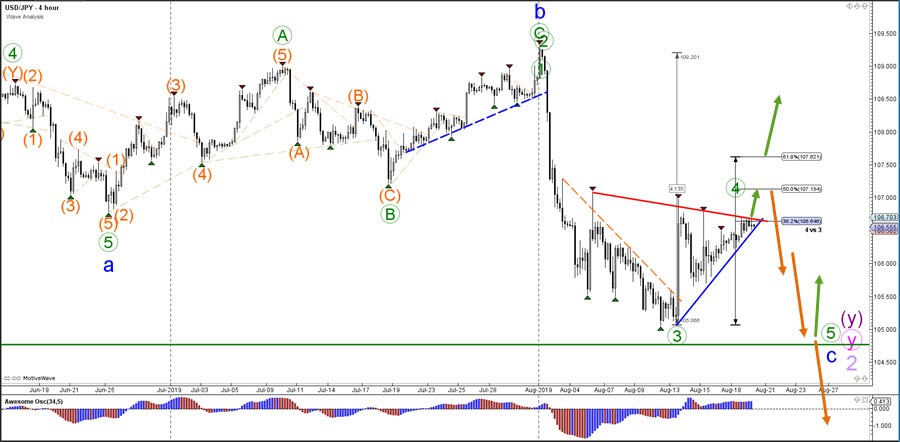
The USD/JPY is retesting the 38.2% Fibonacci retracement level for the third time. A bearish bounce seems likely as long as the price stays below 107.50.
USD/JPY
4 hour
The USD/JPY could break the resistance trend line (red) but then a bearish bounce and potential reversal could take place at the 50% Fibonacci level of wave 4 vs 3. If price however breaks above the 61.8% Fib then a larger bullish reversal is likely taking place.
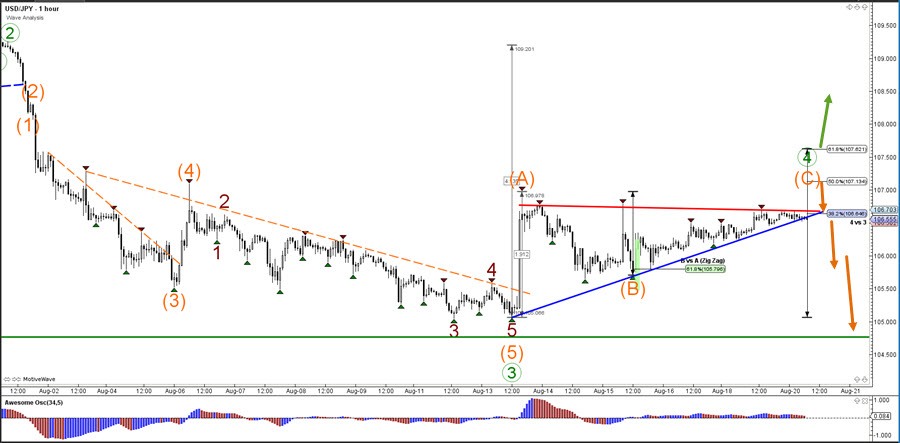
1 hour
The USD/JPY bounce at the 38.2% or 50% Fibonacci retracement level of wave 4 vs 3 could confirm the wave 4 (green) pattern. A bearish bounce is likely to aim for the support zone (green), which is a key and critical decision zone for the current wave 2 (purple). A break below the support zone (green) could indicate a larger bearish trend.
The analysis has been done with the CAMMACD.MTF template.
For more daily technical and wave analysis and updates, sign-up up to our ecs.LIVE channel.
Author

Chris Svorcik
Elite CurrenSea
Experience Chris Svorcik has co-founded Elite CurrenSea in 2014 together with Nenad Kerkez, aka Tarantula FX. Chris is a technical analyst, wave analyst, trader, writer, educator, webinar speaker, and seminar speaker of the financial markets.


