USD/JPY Forecast: Yearns for monthly close above 114.00

The USD/JPY continues to find takers below the monthly 50-MA, still on a larger scheme of things, the outlook would turn bullish only after a monthly close above 114.00 handle.
Monthly chart
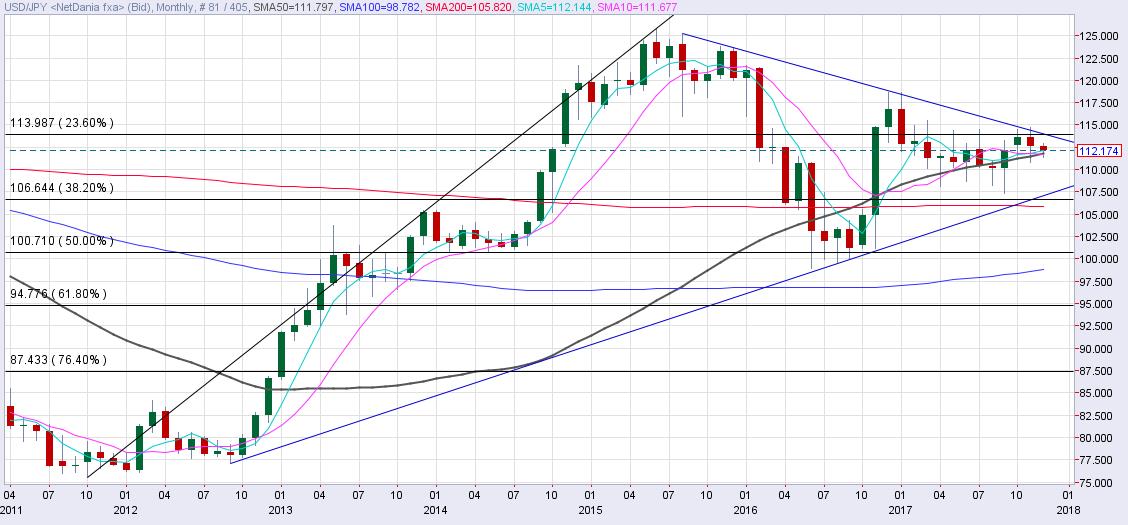
Source: Netdania
The above chart shows-
- The year began on a negative note as the spot ended January below 113.99 (23.6% Fib R of 2011 low - 2015 high).
- Since then, 113.99 has proved a tough nut to crack. Multiple monthly candles have failed to close above the same.
- Also, now the level is more important as it also represents the resistance offered by the trendline sloping downwards from the Aug. 2015 high and Dec. 2015 high.
- So, only a monthly close above 114.00 would revive the long-term bull run.
Pair likely to test 114.00 this month
Monthly chart
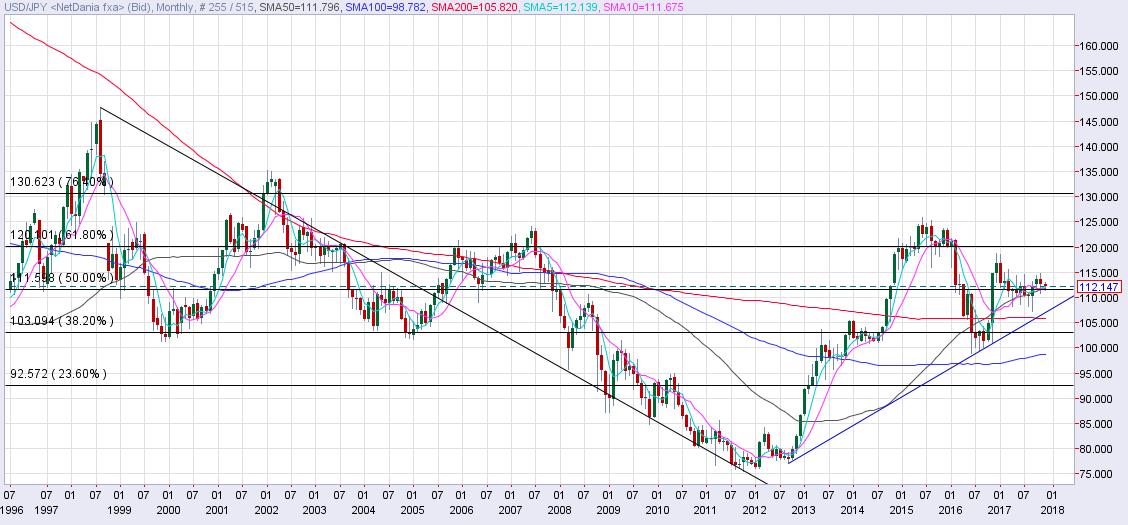
Source: Netdania
- A combination of higher lows, ascending 5-MA, 10-MA and 50-MA and strong dip demand below 111.60 (50% Fib R of 1998 high - 2011 low) indicates the spot is likely to test 114.00 this month.
That said, the short-term outlook is bullish as well.
4-hour chart
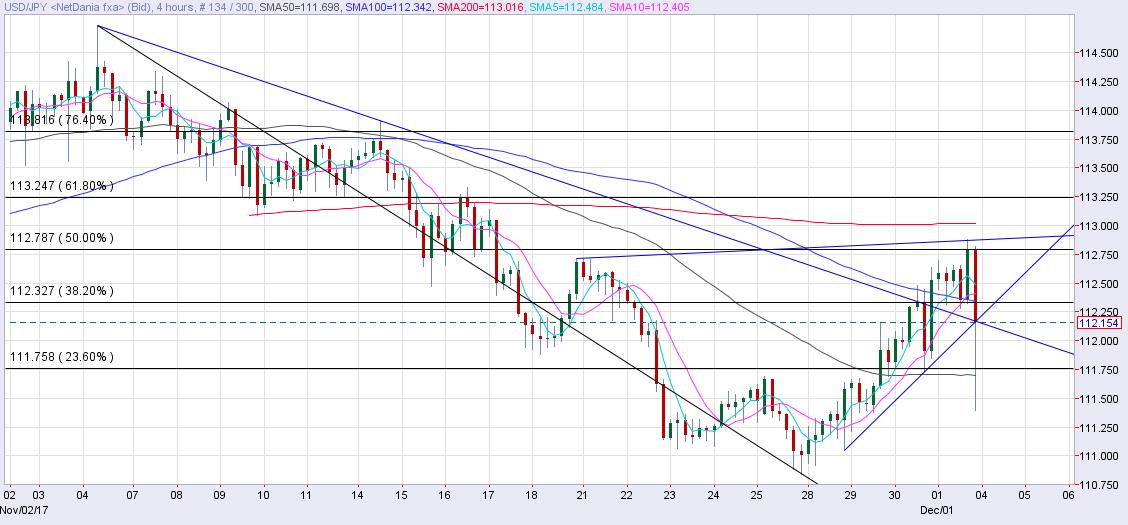
Source: Netdania
- The sharp recovery from the low of 111.39 validates the fact that 50-MA has shed bearish bias (is bottomed out).
- Further, the higher lows pattern remains intact as well.
- The 4-hour chart also shows potential inverse head and shoulders with neckline hurdle around 112.90
- On the monthly chart above, the 5-MA, 10-MA and 50-MA favor the bulls.
Hence, the pair looks set to test 113.25 (61.8% Fib R of Nov. 6 high - Nov. 27 low) levels soon.
Bearish scenario - A daily close below 110.84 (recent low) would revive the sell-off from the Nov. 6 high of 114.74.
FXStreet Forecast Poll shows the market is bullish on the USD/JPY pair.
Author

Omkar Godbole
FXStreet Contributor
Omkar Godbole, editor and analyst, joined FXStreet after four years as a research analyst at several Indian brokerage companies.


