USD/JPY Forecast: Triangle breakdown confirmed amid treasury yield curve inversion

The USD/JPY pair looks set to test the crucial 100-day moving average (MA) support, having witnessed a symmetrical triangle breakdown yesterday.
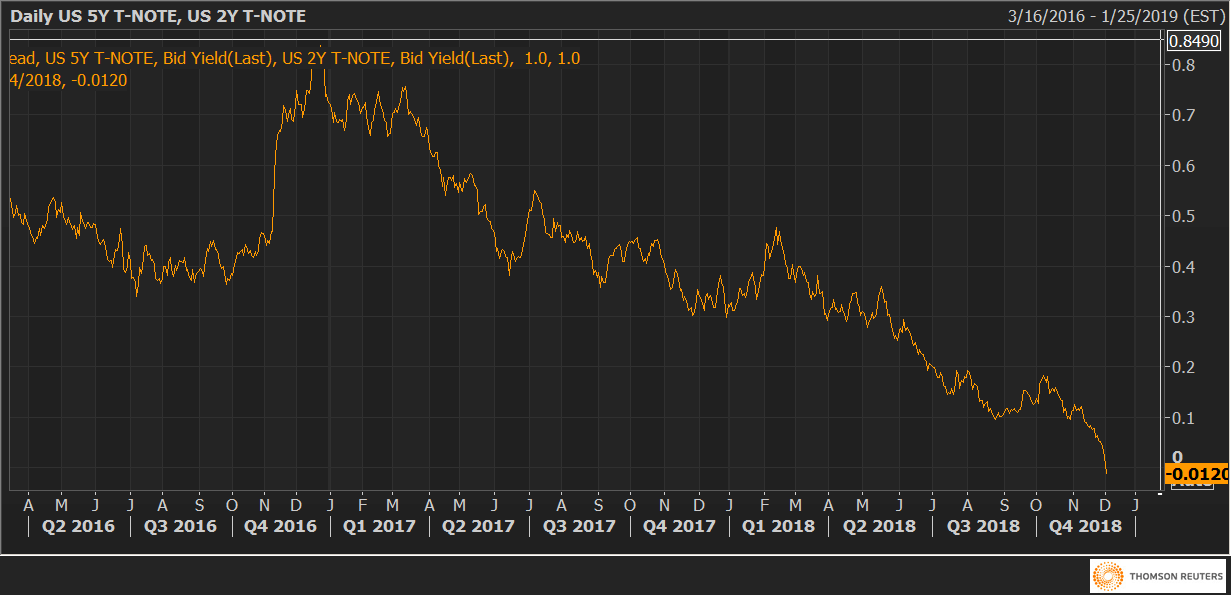
The currency pair fell to a two-week low of 112.58 yesterday as the spread between the five-year and two-year treasury yields inverted (turned negative).
More importantly, the US equities responded negatively to curve inversion, validating the argument put forward by many that an inverted yield curve represents an impending recession.
As a result, the USD may remain on the defensive, more so, because the spread between the 10-year and 2-year yield is also falling fast and could turn negative in the near future.
That would prove costly for the USD/JPY as Japanese investors are long treasuries and may begin unwinding their positions (profit taking) if the rates at the long end of the curve drop below the short-end rates.
So, the odds are stacked in favor of a drop to the 100-day MA.
Daily chart
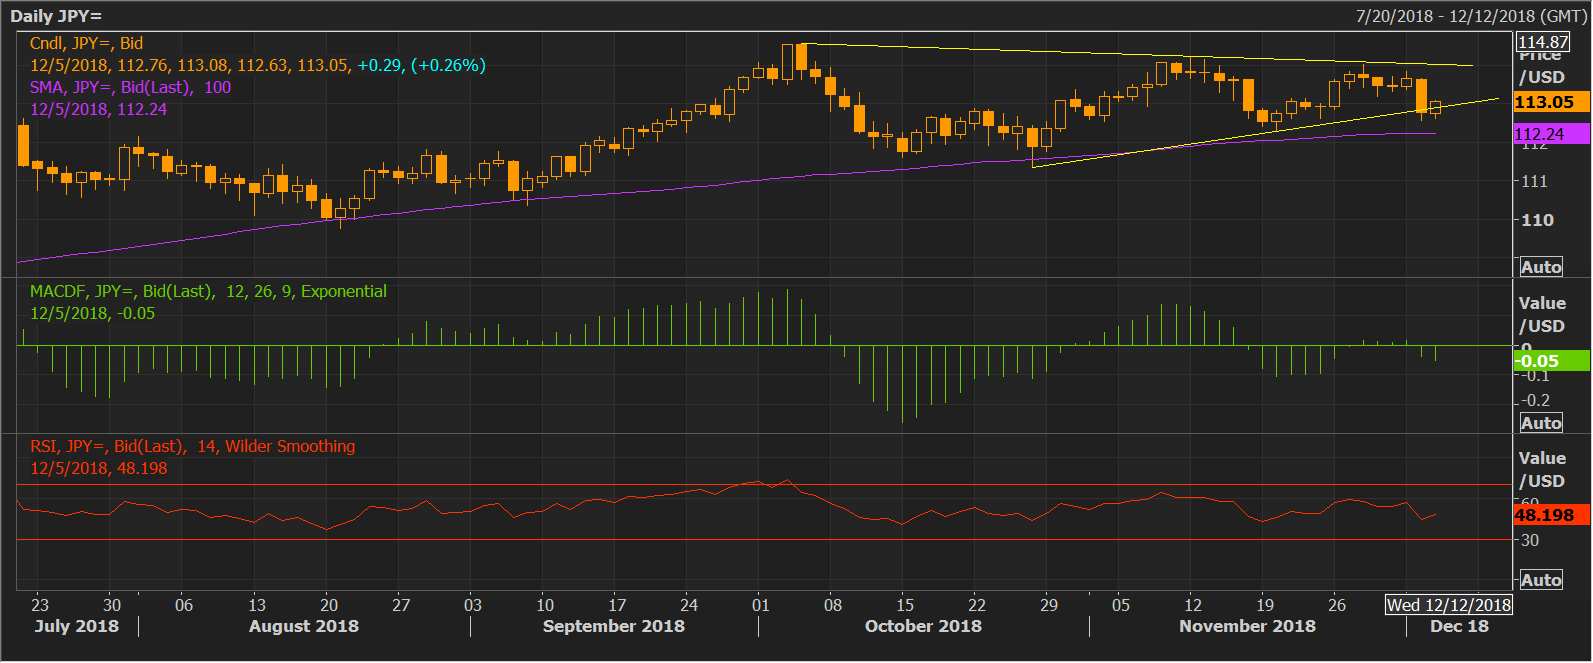
The symmetrical triangle breakdown confirmed yesterday indicates the bears have come out victorious in a tug of war with the bulls. Further, the 4-day RSI has dropped into bearish territory below 50.00. The MACD histogram has dropped below zero, meaning the bearish move is about to gather pace.
As a result, the 100-day MA support of 112.24 could be put to test in the next day or two. Indeed, the spot has moved back higher to 113.00. These gains, however, could be short-lived, courtesy
It is worth noting that the 100-day MA caught the lows on a closing basis in August, September and October. As a result, a close below that level would signal an end of the rally from the March low of 104.63.
US 5y-2y curve inversion
Author

Omkar Godbole
FXStreet Contributor
Omkar Godbole, editor and analyst, joined FXStreet after four years as a research analyst at several Indian brokerage companies.


