Seldom has the 100-day simple moving average (SMA) been so important in any market as it is for the USD/JPY pair.
This is because, throughout 2018, the long-term moving average has reversed pullbacks in the pair. As seen in the chart below, the pair scaled the 100-day SMA hurdle on April 25 and has since then charted higher lows along the SMA support.
Daily chart
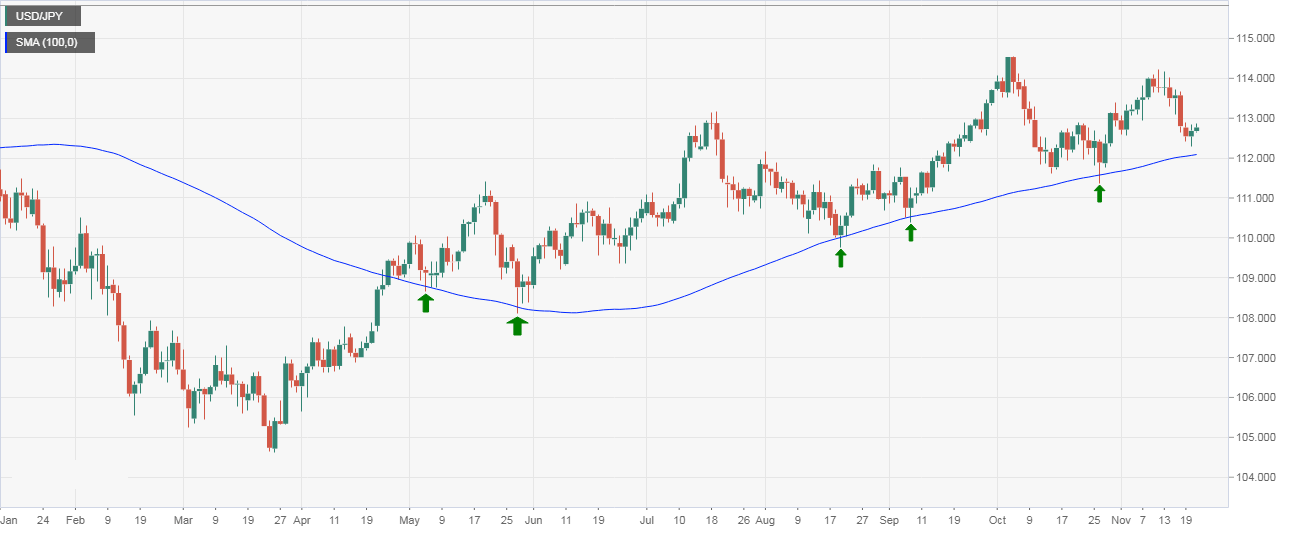
The above chart also shows that a rebound from the 100-day SMA has ended up creating a fresh higher high more often than not. For instance, the pair found takers around the 100-day SMA on May 29 and went on to set a higher high of 113.18 (July 19 high) before falling back to the SMA support. On similar lines, the pair carved a higher high at 114.54 last month, having bounced off the 100-day SMA in September.
The pair's recent bounce from the 100-day SMA witnessed on Oct. 26, however, ended up carving a lower high at 114.23. While that is a cause for concern, a bearish reversal is still not confirmed as the spot is yet to breach the 100-day SMA support, currently at 112.08.
As seen in the chart, the bears have persistently failed to breach the long-term SMA support on the daily closing basis. Therefore, a bullish-to-bearish trend change would be confirmed if the spot closes below the 100-day SMA. The breakdown, if confirmed, would open the doors for a deeper sell-off to levels below 110.00.
Notably, the likelihood of the pair finding acceptance below the 100-day SMA in the next few days is quite high as:
- Markets have begun pricing in the possibility of a Fed rate hike pause in 2019. Fed's Powell took note of the domestic and overseas risks to the US economy forcing many to question the central bank's commitment to raising rates three times in 2019.
- The US 10-year treasury yield is threatening a double top breakdown. The bearish pattern, if confirmed, could drive the USD lower across the board.
- The USD/JPY bulls have likely run out of steam as indicated by the pair's failure to create a higher high above 114.55 despite the strong bounce from the 100-day SMA, as seen on Oct. 26.
At press time, the pair is trading at 112.79, having clocked a low of 112.30 yesterday.
Information on these pages contains forward-looking statements that involve risks and uncertainties. Markets and instruments profiled on this page are for informational purposes only and should not in any way come across as a recommendation to buy or sell in these assets. You should do your own thorough research before making any investment decisions. FXStreet does not in any way guarantee that this information is free from mistakes, errors, or material misstatements. It also does not guarantee that this information is of a timely nature. Investing in Open Markets involves a great deal of risk, including the loss of all or a portion of your investment, as well as emotional distress. All risks, losses and costs associated with investing, including total loss of principal, are your responsibility. The views and opinions expressed in this article are those of the authors and do not necessarily reflect the official policy or position of FXStreet nor its advertisers. The author will not be held responsible for information that is found at the end of links posted on this page.
If not otherwise explicitly mentioned in the body of the article, at the time of writing, the author has no position in any stock mentioned in this article and no business relationship with any company mentioned. The author has not received compensation for writing this article, other than from FXStreet.
FXStreet and the author do not provide personalized recommendations. The author makes no representations as to the accuracy, completeness, or suitability of this information. FXStreet and the author will not be liable for any errors, omissions or any losses, injuries or damages arising from this information and its display or use. Errors and omissions excepted.
The author and FXStreet are not registered investment advisors and nothing in this article is intended to be investment advice.
Recommended Content
Editors’ Picks
EUR/USD flirts with 1.0500 on mixed US PMI readings
The bullish momentum remains unchanged around EUR/USD on Friday as the pair keeps its trade close to the area of multi-week highs around the 1.0500 barrier in the wake of the release of mixed results from the preliminary US Manufacturing and Services PMIs for the current month.
GBP/USD challenges recent peaks near 1.2450
GBP/USD pushes harder and puts the area of recent two-week highs near 1.2450 to the test on the back of the intense sell-off in the Greenback, while the British pound also derives extra strength from earluer auspicious prints from advanced UK Manufacturing and Services PMIs.
Gold keeps the bid bias near its all-time high
Gold prices maintain the bid tone near their record top at the end of the week, helped by the intense weakness around the US Dollar, alleviating concerns surrounding Trump's tariff narrarive, and a somewhat more flexible stance towards China.
Dogelon Mars pumps more than 85%, whales dump 128 billion coins and realize a profit
Dogelon Mars (ELON) price continues its rally on Friday after rallying more than 18% this week. On-chain data shows that ELON whale wallets realized profits during the recent surge. The technical outlook suggests a rally continuation of the dog-theme meme coin, targeting double-digit gains ahead.
ECB and US Fed not yet at finish line
Capital market participants are expecting a series of interest rate cuts this year in both the Eurozone and the US, with two interest rate cuts of 25 basis points each by the US Federal Reserve and four by the European Central Bank (ECB).
Trusted Broker Reviews for Smarter Trading
VERIFIED Discover in-depth reviews of reliable brokers. Compare features like spreads, leverage, and platforms. Find the perfect fit for your trading style, from CFDs to Forex pairs like EUR/USD and Gold.