|

USD/JPY Forecast: Retreating from critical resistance

USD/JPY Current Price: 109.50

  • Softer-than-expected US employment report helped the yen recover some ground.
  • Japan data mixed, continues to indicate moderated economic growth.
  • USD/JPY easing, but bearish potential limited, according to intraday technical readings.

The dollar rallied against the JPY throughout the week but was unable to take the 109.70 price zone, where sellers have been aligned since last December, ending Friday little changed around 109.50. The USD/JPY pair traded as high as 109.68, as risk-appetite weighed on the safe-haven yen. Japanese data released at the beginning of the day came in mixed, at November Overall Household Spending, which declined by 2.0%, well below the 2.5% advance expected. The preliminary estimate for the Leading Economic Index for the same month, beat expectations by printing at 90.9, while the Coincident Index came in at 95.1, also above the market’s forecast.

The rally stalled after a softer-than-anticipated US employment report, which led to some losses in Wall Street, and also to a retracement in US government debt yields. The yield on the benchmark 10-year note finished the week at 1.82 after peaking mid-week at 1.87%. Japan will kick-start the week with a holiday, which means there won’t be macroeconomic releases.

USD/JPY short-term technical outlook

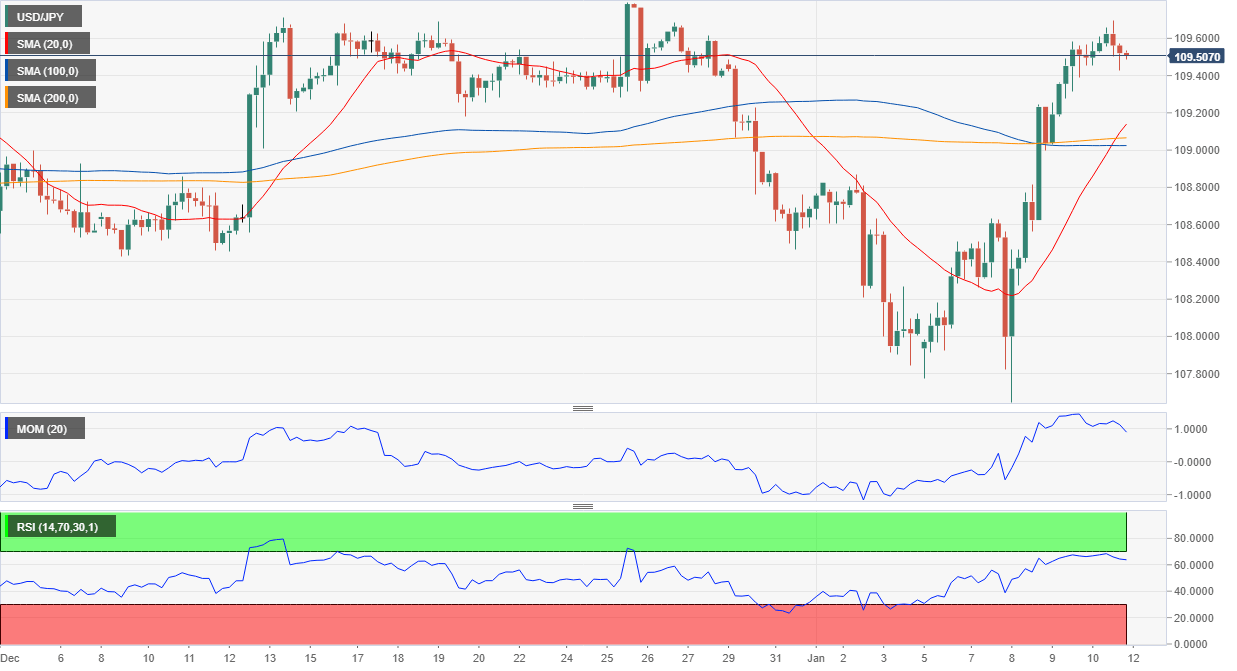
The USD/JPY pair’s bullish stance persists, although it’s losing momentum. In the daily chart, the pair is still above all of its moving averages, while the Momentum indicator is barely entering positive levels and the RSI turning lower, currently at around 57. In the shorter term, and according to the 4-hour chart, the bearish potential is limited, as technical indicators are easing from extreme overbought levels, while the pair develops above all of its moving averages. A firmly bullish 20 SMA is crossing above the larger ones. The pair could turn bearish once below 108.90 a critical Fibonacci support level.

Support levels: 109.25 108.90 108.50  

Resistance levels: 109.70 110.00 110.40

View Live Chart for the USD/JPY

Author

Valeria Bednarik

Valeria Bednarik was born and lives in Buenos Aires, Argentina. Her passion for math and numbers pushed her into studying economics in her younger years.

More from Valeria Bednarik
Share:

Markets move fast. We move first.

Orange Juice Newsletter brings you expert driven insights - not headlines. Every day on your inbox.

By subscribing you agree to our Terms and conditions.

Editor's Picks

EUR/USD climbs toward 1.1800 on broad USD weakness

EUR/USD gathers bullish momentum and advances toward 1.1800 in the second half of the day on Tuesday. The US Dollar weakens and helps the pair stretch higher after the employment report showed that Nonfarm Payrolls declined by 105,000 in October before rising by 64,000 in November.

GBP/USD climbs to fresh two-month high above 1.3400

GBP/USD gains traction in the American session and trades at its highest level since mid-October above 1.3430. The British Pound benefits from upbeat PMI data, while the US Dollar struggles to find demand following the mixed employment figures and weaker-than-forecast PMI prints, allowing the pair to march north.

Gold extends its consolidative phase around $4,300

Gold trades in positive above $4,300 after spending the first half of the day under bearish pressure. XAU/USD capitalizes on renewed USD weakness after the jobs report showed that the Unemployment Rate climbed to 4.6% in November and the PMI data revealed a loss of growth momentum in the private sector in December. 

XRP dips as bearish pressure persists despite ETF growth

Ripple is finding footing above $1.90 at the time of writing on Tuesday after a bearish wave swept across the broader cryptocurrency market, building on persistent negative sentiment.

Ukraine-Russia in the spotlight once again

Since the start of the week, gold’s price has moved lower, but has yet to erase the gains made last week. In today’s report we intend to focus on the newest round of peace talks between Russia and Ukraine, whilst noting the release of the US Employment data later on day and end our report with an update in regards to the tensions brewing in Venezuela.

BNB Price Forecast: BNB slips below $855 as bearish on-chain signals and momentum indicators turn negative

BNB, formerly known as Binance Coin, continues to trade down around $855 at the time of writing on Tuesday, after a slight decline the previous day. Bearish sentiment further strengthens as BNB’s on-chain and derivatives data show rising retail activity.