USD/JPY Forecast: Resilience to end soon?

The Dollar-Yen pair clocked a 7-month high of 114.74 on Monday before ending the day on a weak note at 113.70 levels. Over the last two weeks, the pair has had a tough time holding on to gains above 114.00 hands. Still, the bears have not been able to make good of the opportunity... the downside has been capped around the 113.00 handle.
The pair has remained remarkably resilient despite the decline in the US 10-year treasury yield. The chart below shows the positive correlation between the US 10-year treasury yield and the USD/JPY pair has weakened over the last two weeks.
10-yr yield and the USD/JPY pair
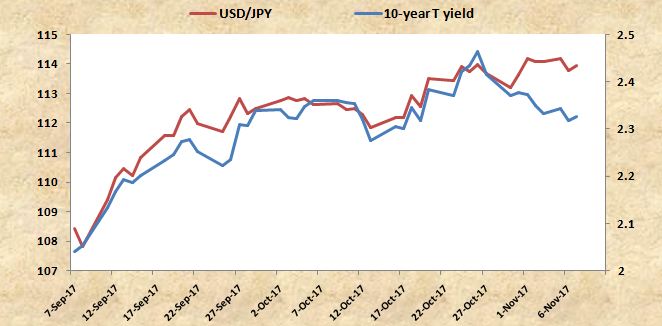
So the obvious question now is will the USD/JPY follow the treasury yield lower? Or will the yield rebound to 2.45%?
First of all, the US data calendar is light this week. The lack of first tier data releases means very low odds of a sharp rise in the 10-year yield to 2.45 percent...
Furthermore, the USD/JPY technical chart is looking increasingly heavy.
Weekly chart
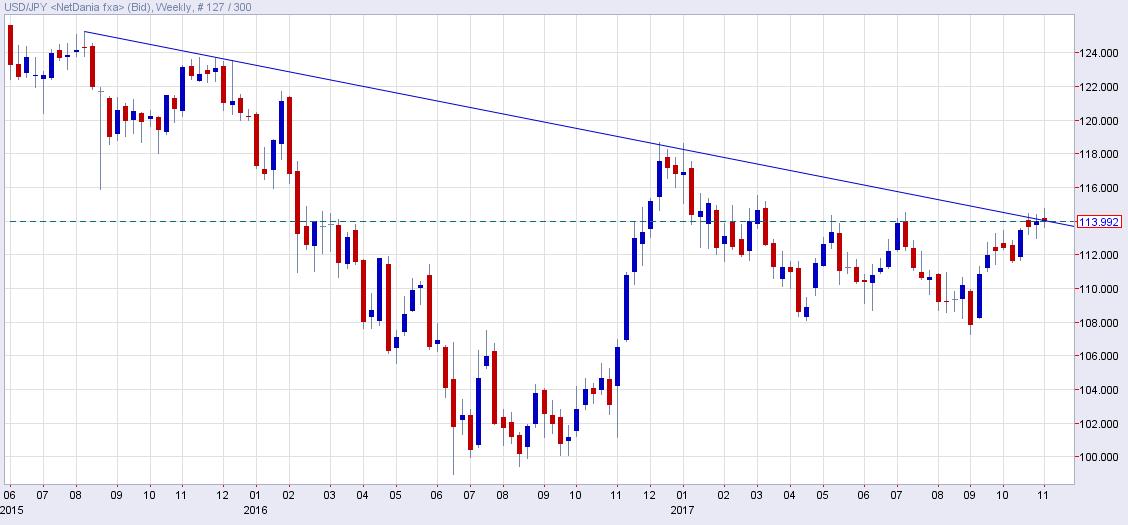
For the third straight week, the spot yearns for a big break above the trend line sloping lower from the Aug. 2015 high and Dec. 2015 high.
Daily chart
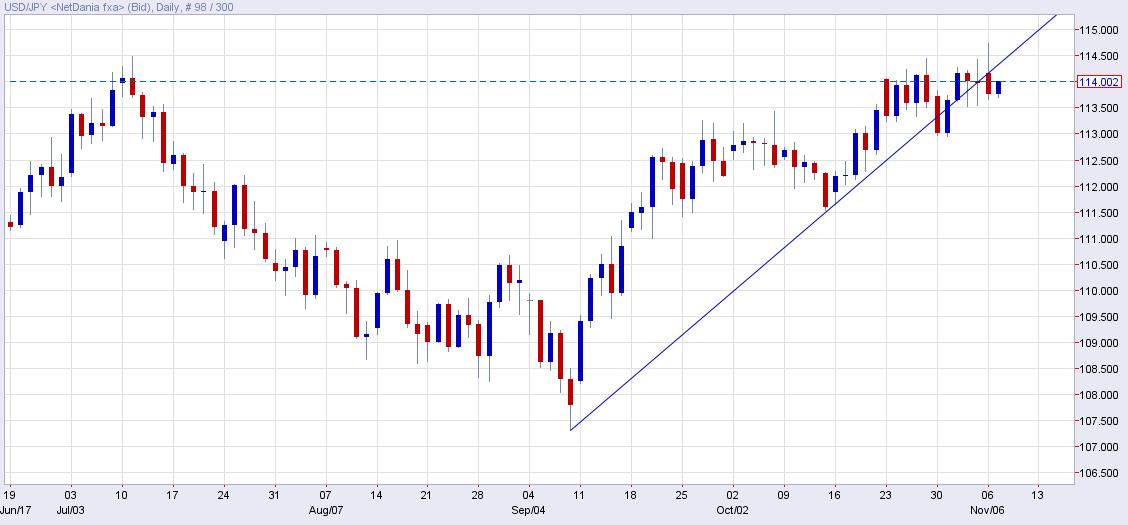
The above chart shows-
- Hanging man candle (Nov. 2)
- Classix textbook doji (Nov. 3)
- Inverted hammer-like candle (Nov. 4)
- Breach of the rising trend line hurdle
View
- The daily chart is loaded with candlesticks showing bull market exhaustion. When viewed in light of the declining treasury yield, the candlesticks signal increased odds of a sell-off.
- Going purely by the technical chart, the bullish-to-bearish trend change will be confirmed only after the Oct. 31 low of 112.95 is breached.
- On the higher side, an end of the day close above the rising trend line would open doors for 115.50 levels.
Author

Omkar Godbole
FXStreet Contributor
Omkar Godbole, editor and analyst, joined FXStreet after four years as a research analyst at several Indian brokerage companies.


