USD/JPY Forecast: Pick-up in US-JP yield differential to yield sustainable rally

The USD/JPY closed on a flat note at 111.38 on Tuesday, having hit an intraday low of 111.00.
Daily chart
-636692884806695064.png)
Hourly chart
-636692885081858433.png)
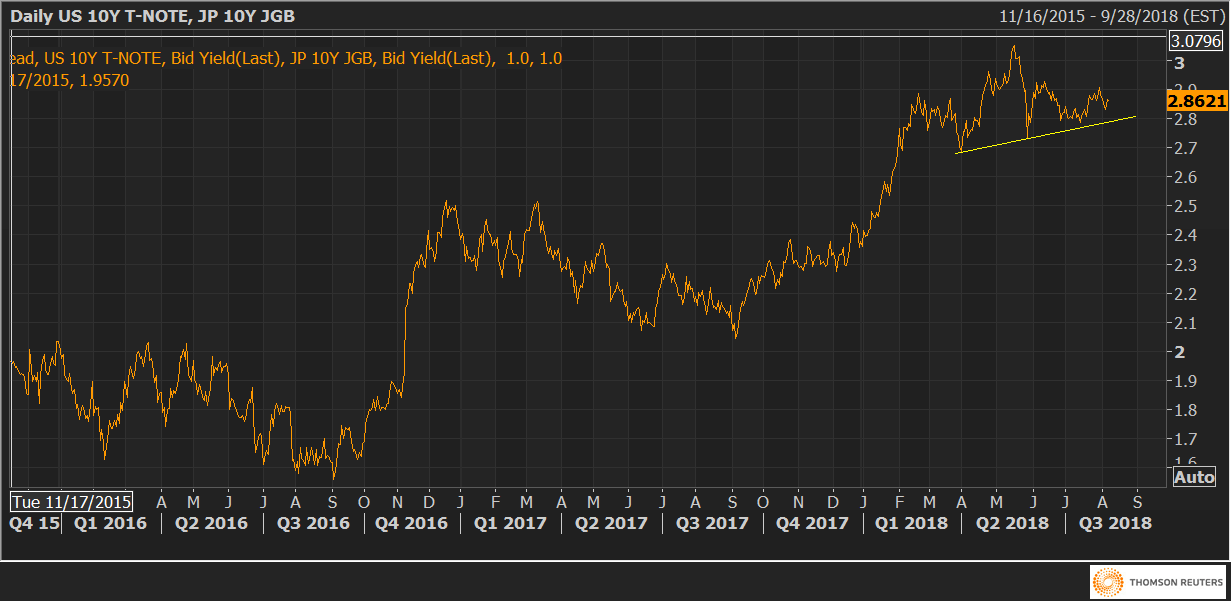
Yield spread chart
The pair created a dragonfly doji candle, a one-day bullish reversal pattern, at the ascending trendline (drawn from the May 29 low and June 26 low). More importantly, the bears failed to penetrate the trendline support for the eighth time in the last 16 days.
The repeated bear failure at the trendline support and the signs of a bullish reversal (dragonfly doji) indicate scope for an upside break of bull flag-like pattern seen in the hourly chart. As of writing, the flag resistance is seen at 111.52. An acceptance above that level would open the doors to a break above last week's high of 112.15.
So, technically speaking, the spot looks set for a bullish move. However, the 10-year US-Japan yield differential is showing no signs of life. At press time, the benchmark yield spread stands at 286 basis points - well below the 2018 high of 305 bps hit in May - and appears to be forming a head-and-shoulders bearish reversal pattern with neckline support at 278 bps.
A quick move above 293 bps (right shoulder high or June 13 high) will likely help the USD post sustainable gains.
Meanwhile, a break below 278 basis points would shift risk in favor of a bearish daily close below the 50-day moving average (MA), currently located at 110.84.
The bears are seen making a strong comeback once the pair finds acceptance below the 50-day MA as the moving average had reversed pullbacks seen in May and June.
View
USD/JPY could revisit the last week's high of 112.15 and could see a sustained break higher if US-Japan bond yield differentials spike. A close below 50-day MA would confirm a bull-to-bear trend change and shift risk in favor of a drop to 100-day MA, currently lined up at 109.56. A bearish close looks likely in case the 10-year yield differential finds acceptance below 278 bps.
AUD/USD Forecast: Bulls need a close above 0.7490
Daily chart
-636692888556610862.png)
Weekly chart
-636692888822865987.png)
The AUD/USD pair is stuck in a narrowing price range or the pennant pattern since July 2.
The area between 0.7420 and 0.75 is packed with stiff resistance lines. To start with, the top end (resistance) of the pennant is located at 0.7426. The resistance of the trendline sloping downwards from the Jan. 26 high and June 7 high is seen at 0.7457. And last but not the least, the trendline drawn from the April 19 high and June 7 high is seen offering resistance at 0.7490.
A convincing break above 0.7490 would add credence to signs of bearish exhaustion (multiple weekly doji candles) and confirm a bear-to-bull trend change. This scenario looks likely as the oversold Chinese yuan is showing signs of life and could yield a rally to the 200-day MA, currently stationed at 0.7651.
On the downside, a close below 0.7310 (July 2 low) would revive the bearish view (or sell-off from the Jan. 29 high of 0.8136).
Author

Omkar Godbole
FXStreet Contributor
Omkar Godbole, editor and analyst, joined FXStreet after four years as a research analyst at several Indian brokerage companies.


