USD/JPY Forecast: Eyes 2015-2018 falling trendline after bullish outside day
- The JPY is on the defensive, possibly due to risk-on action in the financial markets.
- Japanese government pushed back inflation view by year, highlighting the fact that Fed-BOJ divergence is set to grow further.
- USD/JPY created bullish outside day candle yesterday, attacks 2015-2018 downtrend line. Focus on weekly close.

The anti-risk Japanese Yen was offered on Monday as the risk assets, mainly equities, rallied across the globe, having priced-in the US-China trade war well in advance.
The Dow Jones Industrial Average (DJIA) closed 320 points or 1.31 percent higher. The risk-on action lifted USD/JPY to 110.90.
Also, the fading prospects of Japan reaching its 2 percent inflation target may have put a bid under the USD/JPY pair. The Japanese government pushed back its inflation view by a year - so now inflation is seen rising to 2 percent objective in 2H of the fiscal year 2021 vs the previous forecast of 2H of the fiscal year 2020.
What it essentially means is that the Fed-BOJ policy divergence is likely to grow further and the path of least resistance, as per rate differential, is on the higher side. So, the 2015-2018 downtrend line could be eroded soon.
At press time, the USD/JPY pair is better bid around 111.00 and the S&P 500 futures are reporting a 0.30 percent gain.
Weekly chart (linear scale)
-636667825080119515.png)
Weekly chart (log scale)
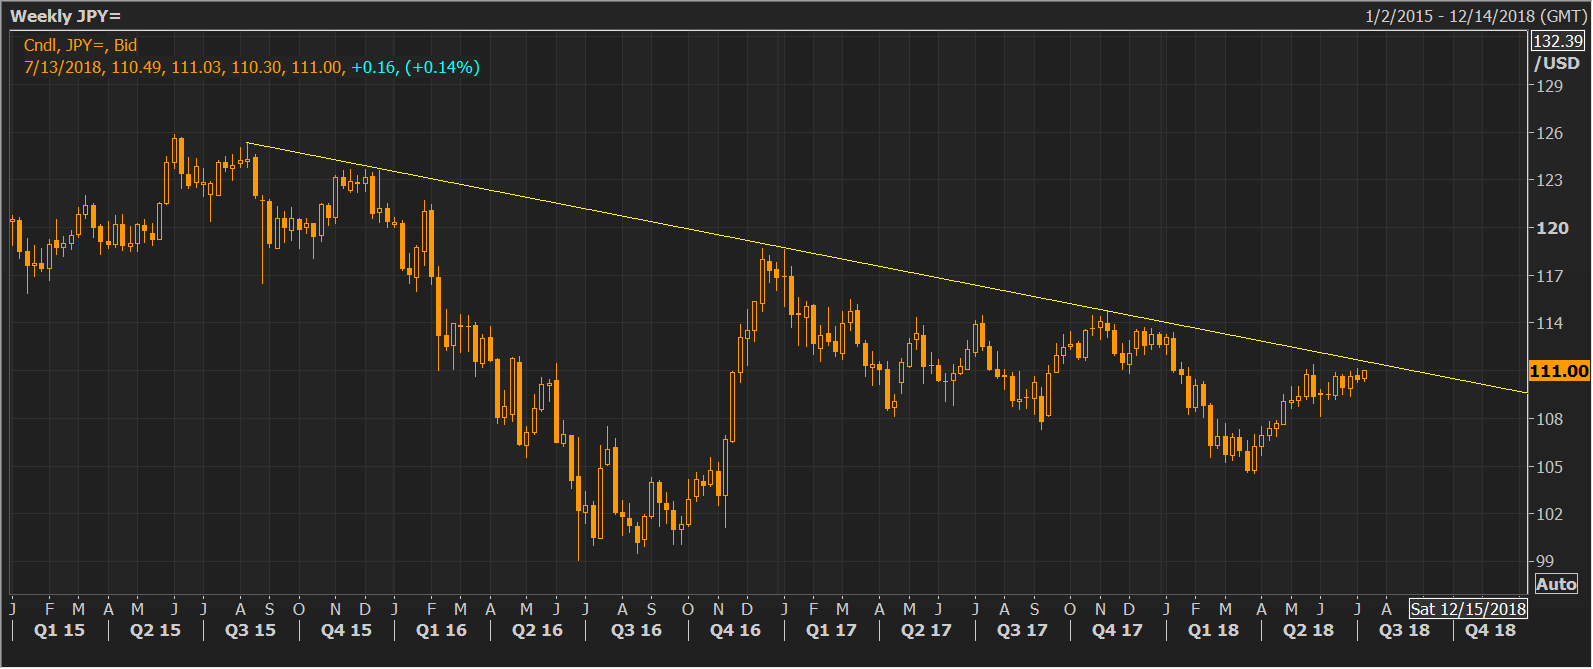
As per linear scaled chart, the USD/JPY pair is currently trading above the 2015-2018 down trendline, while as per the log chart, the trendline resistance is located at 111.55.
A weekly close above 111.55 (Friday's NY close) would confirm a long-term bearish-to-bullish trend change and the daily chart indicates the bull breakout will likely happen soon.
Daily chart
The pair created a bullish outside-day candle on Monday, adding credence to the short-term bullish view put forward by the rising trendline (drawn from March 26 low and May 29 low). So, the 2015-2018 trendline resistance of 111.55 (as per log chart) could be put to test this week.
A sustained move to 111.55 could be on the cards if the pair closes today above 111.13 (last Tuesday's bearish outside-day candle).
On the downside, only a break below the rising trendline would signal a bull-to-bear trend change.
Author

Omkar Godbole
FXStreet Contributor
Omkar Godbole, editor and analyst, joined FXStreet after four years as a research analyst at several Indian brokerage companies.


