USD/JPY Forecast: Eyes 200-week MA hurdle after bull breakout
- The Japanese Yen is losing its safe haven appeal.
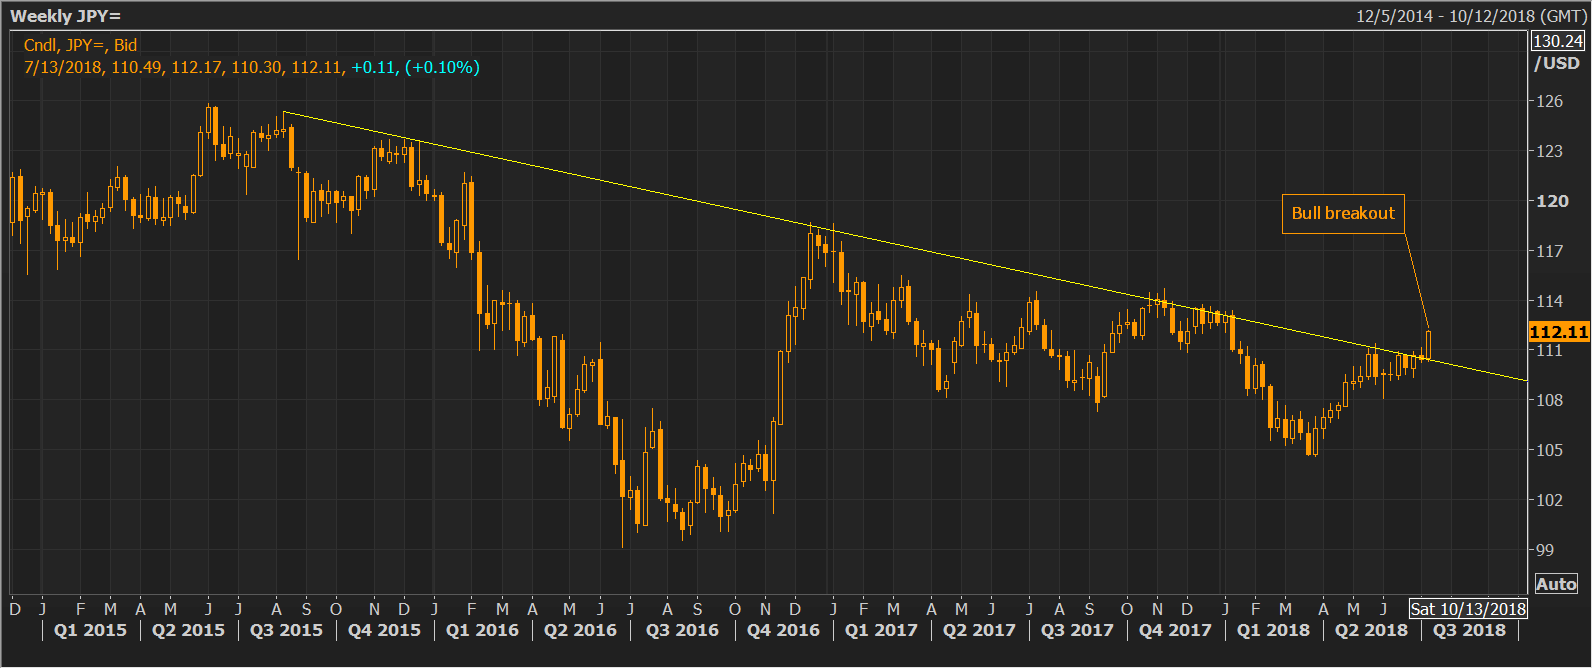
- USD/JPY has eroded 2015-2018 falling trendline.
- The line chart shows the upside break of the 18-month long channel.
- The pair could rise to 113.23 (200-week moving average) before Friday's NY close if the US CPI beats estimates.

The USD/JPY pair rose to a six-month high of 111.12 on Wednesday, contradicting popular narrative which called for a stronger Yen amid trade tensions and risk-off sentiment.
A big move was in the offing as discussed yesterday as volatility, as represented by the monthly chart Bollinger Bands, had hit an 11-year low.
The traditional inter-market correlations have broken down and the Japanese Yen is taking cues from its Asian brethren, particularly Chinese Yuan, which fell below 6.7 per USD yesterday on escalating trade tensions.
Also at play is the growing Fed-BOJ monetary policy divergence. The Japanese central bank is miles away from reaching the 2 percent inflation target and hence policy tightening is still a distant dream.
Meanwhile, inflation is running hot in the US. For instance, the Producer Price Index (PPI) for final demand (FD) rose 3.4 percent for the 12 months ending in June, on an unadjusted basis, the U.S. Department of Labor reported on Wednesday. It was the largest 12-month increase since climbing 3.7 percent in November 2011. So, there is a real risk the Fed would revise higher neutral rate in the near future and shall raise rates at a faster pace.
Further, the technical charts are biased bullish. At press time, the currency pair is trading just above 112.00.
Weekly chart
Daily chart
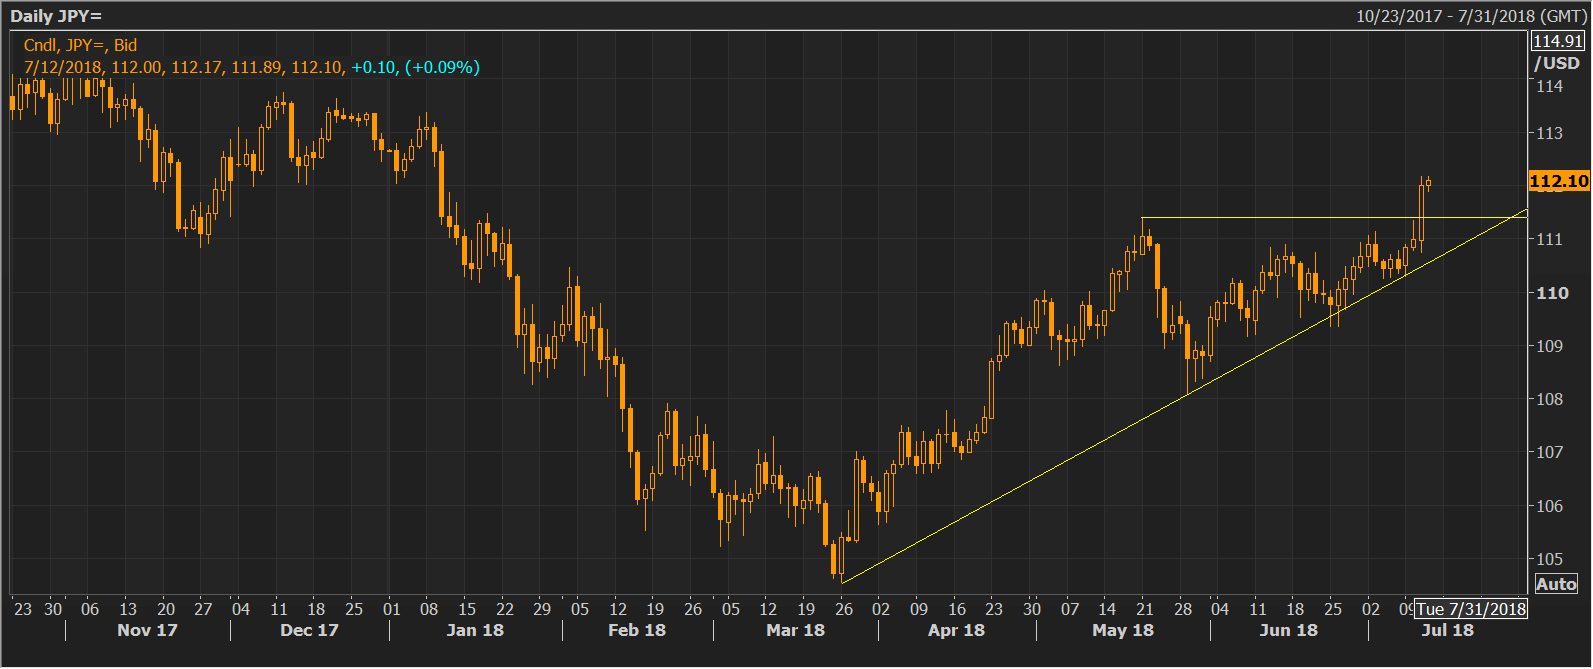
The pair closed above 111.40 (May 21 high) yesterday, adding credence to rebound from the ascending trendline support and crossed the three-year-long falling trendline (drawn from August 2015 high and December 2015 high) with strength.
View
- The bullish breakout has opened the doors to 113.23 (200-week moving average).
- The rally to 113.23 could happen before Friday's NY close if the US consumer price index (CPI), scheduled for release today, beats estimates.
- A weekly close (Friday's close) below 111.00 would abort the bullish view.
Author

Omkar Godbole
FXStreet Contributor
Omkar Godbole, editor and analyst, joined FXStreet after four years as a research analyst at several Indian brokerage companies.


