USD/JPY Forecast: Bulls eye 113.19

The Dollar-Yen pair clocked a low of 111.99 yesterday on modest risk aversion, but ended the day at 112.31, tracking the recovery in the US 10-year treasury yield from 2.31 percent from 2.34 percent. As of now, the spot is trading at 112.64; up 0.35 percent on the day.
The technical charts indicate the spot is caught up in a bull-bear tug of war.
Daily chart
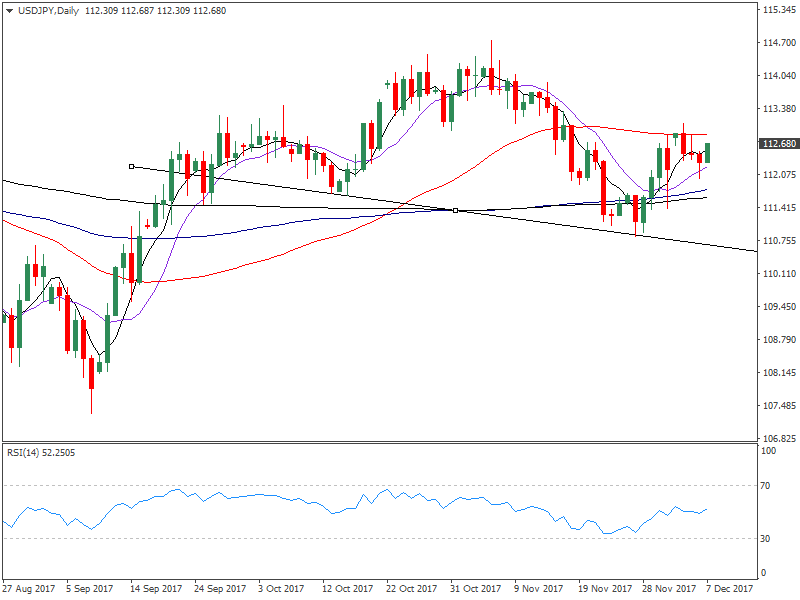
The above chart shows-
- Potential head and shoulders pattern -It is a bearish reversal pattern, but works best at the top of the bull run. As of now, the pair is trading well below the Dec. 2016 high of 118.66. Hence, the pattern is not valid.
- Also, the 5-day MA and 10-day MA are sloping upwards in favor of the bulls. The RSI has just moved above 50.00 (into bullish territory).
4-hour chart
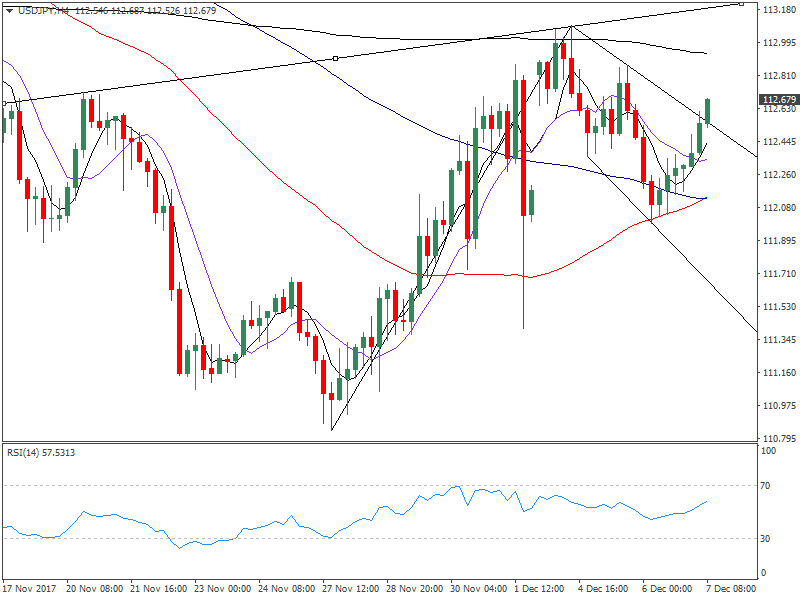
On the above chart-
- It appears the pair is eyeing completion of the inverse head and shoulders pattern with neckline hurdle at 113.19.
- Bull flag breakout - it is a continuation pattern, i.e. it signals the rally from the low of 111.00 has resumed.
- A bullish 50-MA and 100-MA crossover is almost confirmed.
- The RSI favors the bulls.
View
Clearly, the odds are high that bulls would come out victorious. The spot looks more likely to test 113.19 today. A 4-hour close above 113.19 would open up upside towards 115.38 (inverse head and shoulders target breakout target as per the measured height method).
Also, a bull flag breakout has also opened doors for 114.18 (again, target as per the measured height method).
On the downside, only a 4-hour close below 112.00 would abort the bullish view.
Author

Omkar Godbole
FXStreet Contributor
Omkar Godbole, editor and analyst, joined FXStreet after four years as a research analyst at several Indian brokerage companies.


