USD/JPY Forecast 2018: US political jitters and global growth to play in Yen's favor

It was a dull year for the USD/JPY pair that with a few exceptions, spent it ranging. But seen in perspective, price action through these last 12 months says a lot. The pair plunged from a yearly high of 118.60 in January to close that first month at 112.07, ending now the year measly 150 pips above it. The yearly low was established in September at 107.31. An on-hold BOJ amid stubbornly low inflation, coupled with a predictable Fed that was unable to incentivize dollar's demand.
Ever since changing its framework to controlling the yield curve in September 2016, the Bank of Japan did little else. The central bank kept its benchmark interest rate unchanged at minus 0.1%, as it focused on controlling the yield-curve, by keeping the 10-year government bond yield near zero percent, a silent statement indicating that there is not much more policymakers can do to. In the meantime, the central bank keeps buying bonds.
Abenomics had worked only partially, as the economy has been actually growing GDP grew by 2.5% in the third quarter of 2017 and is now in its longest expansion strike in over 20-years. Inflation, however, remains well off their 2% target. Consumer prices in Japan rose 0.2% year-on-year in October of 2017, following a 0.7% in the prior two months and matching market consensus, the lowest reading since March. Core CPI increased 0.8% in the mentioned month. The main issue Japan faces these days is the poor wage growth. That's the reason why economic growth didn't translate into higher inflation. In the same quarter, private consumption fell 0.5%, a worrying sign, but not a surprise, as real wages rose for the first time for the year in October, when they gain a measly 0.2%.
As said, the BOJ has little room to maneuver, and a change in the current monetary policy stance is out of sight for now. However, Kuroda & Co. may be lucky and finally see inflation rising, not because of their ultra-loose monetary policy, but because of the global economic recovery. Besides, it doesn't seem that the US economy could outpace their major rivals in growth terms. In fact, it seems more likely it will lag behind amid continued political woes interferences. The upcoming Fed's head, Jerome Powell, is the only unknown factor in this equation, but in the current environment, Powell could promise a lot, but is yet to be seen what the market would buy.
The Japanese yen has more chances than ever to firm up against the dollar next year.
USD/JPY technical outlook
There's a particular situation around the USD/JPY pair that worth adding at the beginning of this technical view: the pair tends to depreciate during the first quarter of each year, ahead of the end of the fiscal year that takes place by the end of March, mostly due to yen's repatriation of profits earned abroad from corporations, before closing their books. Despite it has been gradually declining over the past few years, it's still a big market motor, starting February.
Another strong factor to consider is US Treasury yields´ behavior. Beyond the situation in Japan, the pair has followed the lead of yields pretty much exclusively during the second half of the year, ignoring the rally in equities to record highs, and with risk sentiment making limited impressions in the pair.
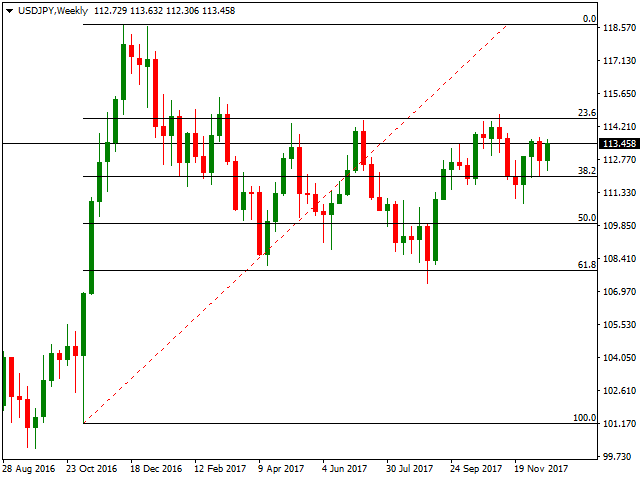
After rallying straight from 101.18 to 118.66 by the end of 2016, the pair began a corrective movement that bottomed last August at the 61.8% retracement of the mentioned rally. The 23.6% retracement of such rally at 114.56 to be precise, has been a major cap all through the year, and while the price trades near this last, there's no catalyst at sight that could actually trigger such bullish breakout. Still, the pair could enter a bullish market only on a steady advance beyond the mentioned 2017 high at 118.60. To confirm a bearish trend, on the other hand, the key is the 108.00 region that could open doors for a steady decline towards the 105.00 price zone.
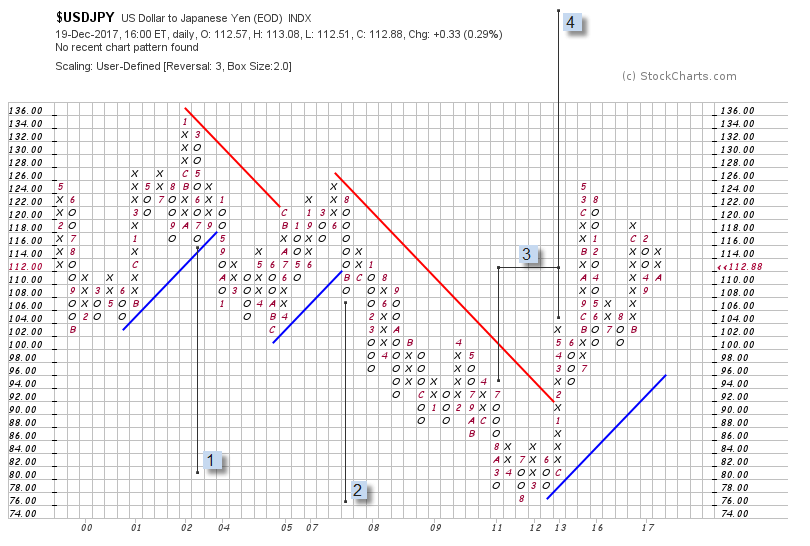
USD/JPY Point & Figure Chart

The potential for gains is as high as 150.00 which is a target ascertained by a 3-box reversal chart with a 200-pip box. These settings proved to be useful when we consider the filled projections from counts 1 and 2 established in 2002 and 2007 which reached the destination in 2011/12 at 80.00 and 76.00. The horizontal count labeled 3 has been already achieved at 112.00, a level which has been the line in the sand for this pair.
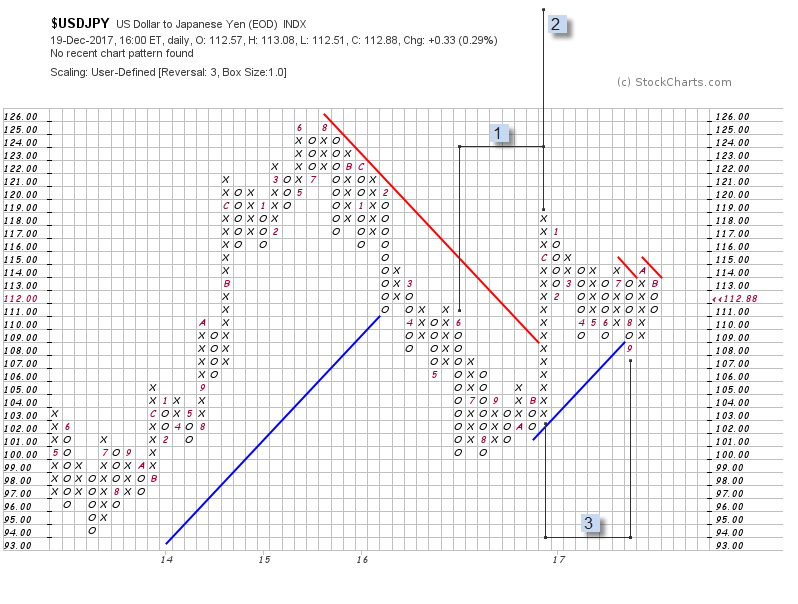
A 100-pip box size chart supports our bullish roadmap prediction, with clear targets readable overhead, namely 124.00 and 150.00 (note the cluster with the above chart reinforcing this price level). At the same time, we cannot ignore the fact that this year's price range does carry an unfilled count to 94.00 and likely lower once a new count can be drawn from the once established pattern.
Author

Valeria Bednarik
FXStreet
Valeria Bednarik was born and lives in Buenos Aires, Argentina. Her passion for math and numbers pushed her into studying economics in her younger years.


