USD/JPY Forecast: 200-day MA could be put to test

The USD/JPY pair fell below the 50-day MA today for the first time since Sept. 15. The currency pair hit a one-month low of 112.39 and was last seen trading around 112.47 levels; down 0.5 percent on the day.
The USD selling is being blamed on the Mueller subpoena story. Also hurting the American dollar is the continued flattening of the Treasury yield curve. Meanwhile, the BOJ's decision to trim the purchases of the short-duration (1-year to 3-year) bonds could have strengthened the bid tone around the Japanese Yen as well.
While a breakthrough on the tax reform front could lift the USD, for now, the technical studies indicate a scope for a drop below 112.0 levels.
USD/JPY 4-hour chart
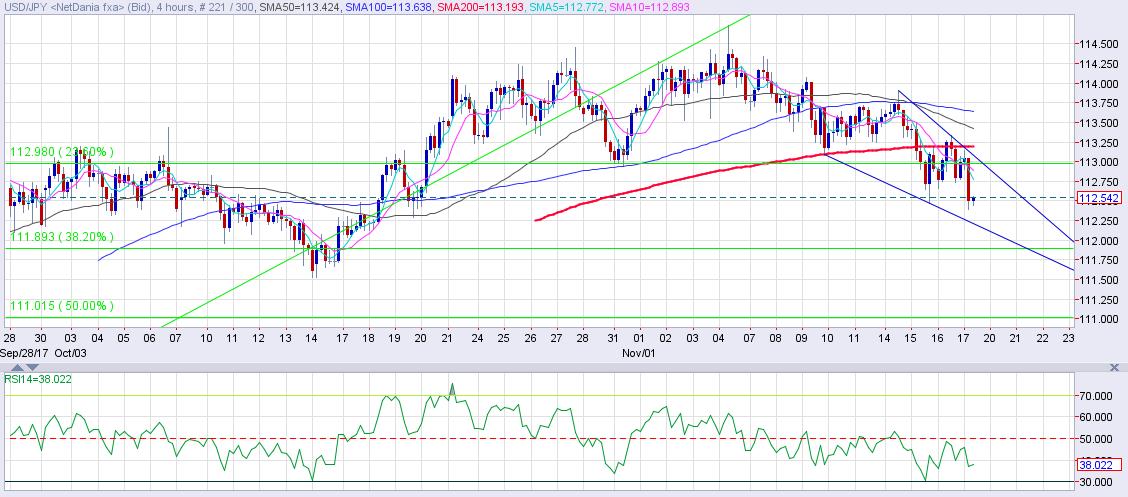
- The weak hands have been crowded out, says the above chart as the pair peeped above the head and shoulders neckline hurdle before falling back to the 50-day MA.
- The failure to hold above the neckline hurdle and a drop to one-month lows below the 50-day MA, amid flattening of the Treasury yield curve indicates the spot is likely to extend losses to sub-112.00 levels.
- The 50-MA, the 100-MA and the 200-MA have topped out as well.
- The chart also shows a falling wedge pattern, which is likely to offer support around 112.20-112.10 levels. A break below the same would only end up strengthening the case for a drop to the head and shoulders (H&S) target of 111.56. Interestingly, the H&S target is closely aligned with the 100-day MA (111.73) and 200-day MA (111.76).
- The 4-hour RSI is well short of the oversold territory, thus there is sufficient room for a sell-off to at least 111.76 (200-day MA) levels.
Still, there is merit in being 'cautiously bearish' as the 50-day MA still carries a strong bullish bias.
Daily chart
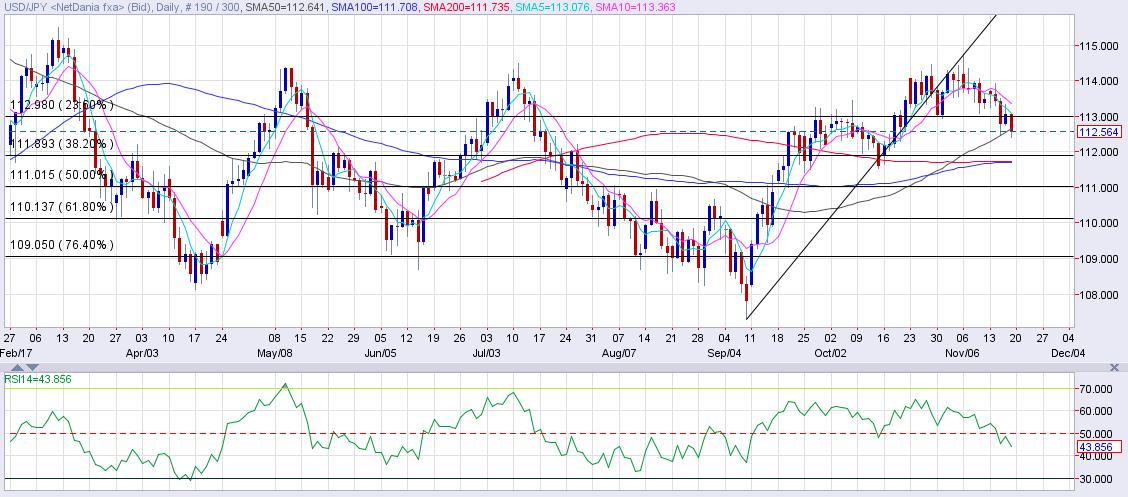
- On the above chart, the 50-MA is sloping upwards (bullish bias). However, the 5-day MA and 10-day MA have adopted a bearish bias.
- Also, the RSI shows a double top breakdown and currently sits in the bearish territory (below 50.00).
View
Again, the spot looks set to test the 200-day MA level of 111.76 and any upticks are likely to run out of steam in the range defined by the downward sloping 5-day MA and 10-day MA.
Author

Omkar Godbole
FXStreet Contributor
Omkar Godbole, editor and analyst, joined FXStreet after four years as a research analyst at several Indian brokerage companies.


