USD/JPY eyes space north of ¥110, targeting daily resistance at ¥110.86-110.27

EUR/USD
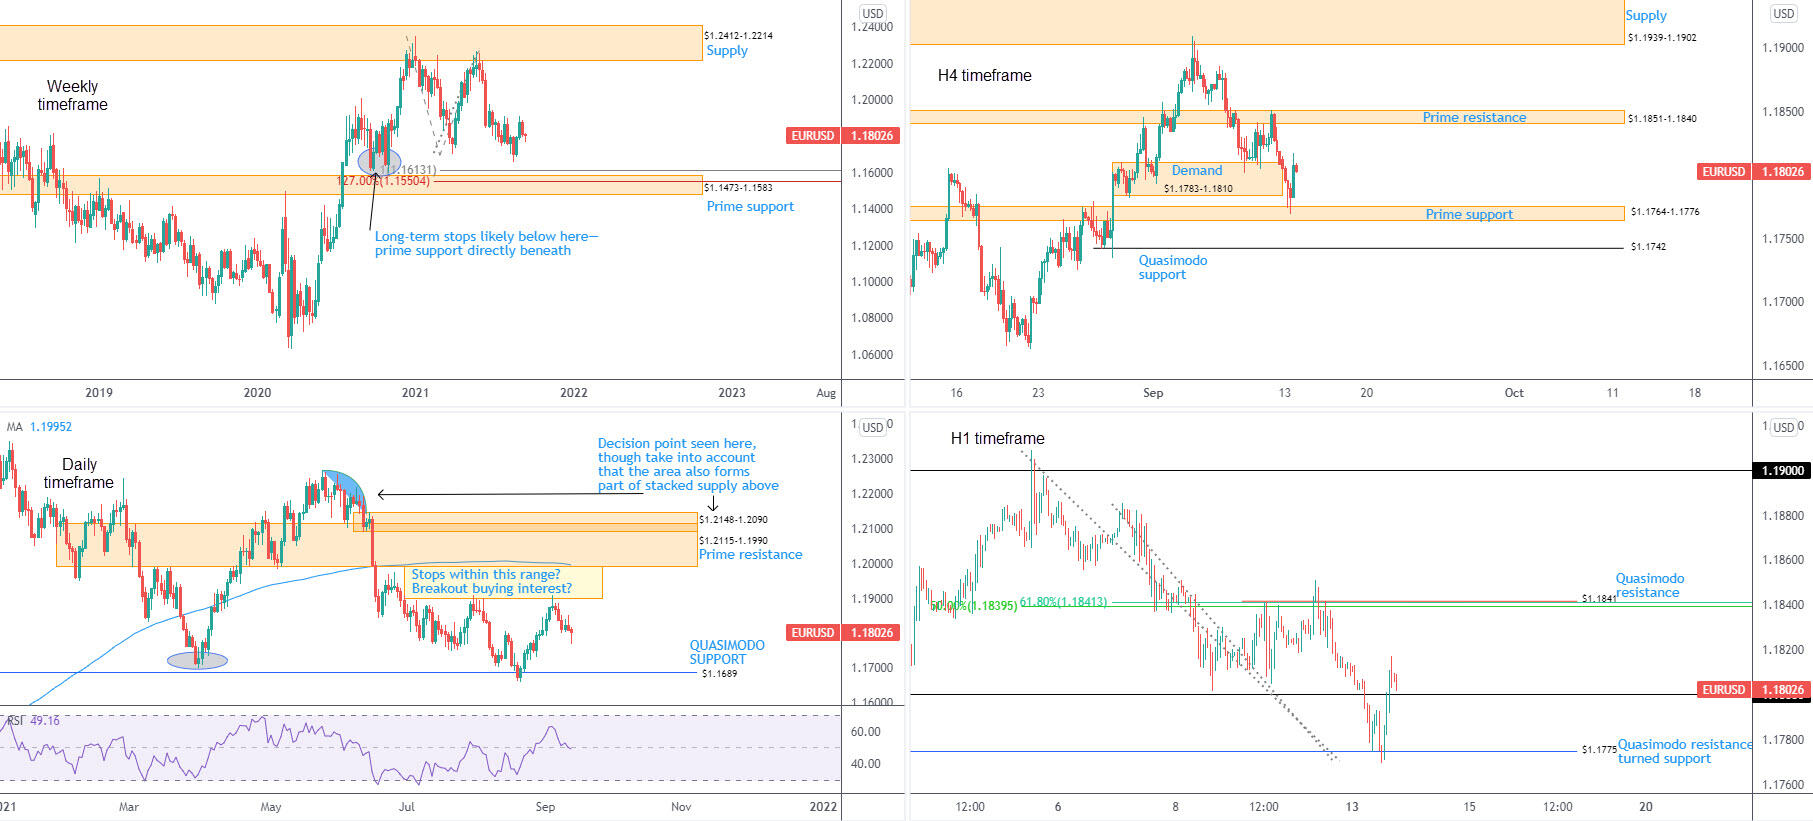
Prime support on the weekly timeframe resides at $1.1473-1.1583—sharing space with a 100% Fib projection at $1.1613 as well as a 1.27% Fib extension at $1.1550. Interestingly, long-term stops likely rest south of the $1.1640ish lows and perhaps accommodate enough energy to fill $1.1473-1.1583 bids. To the upside, the spotlight is on supply at $1.2412-1.2214. With respect to trend, we can see the market has largely been higher since the early months of 2020.
Based on the daily timeframe, the US dollar—measured by the US dollar index—eased off two-week tops Monday, developing what many candlestick enthusiasts refer to as a shooting star. This, in light of the inverse correlation between the DXY and EUR/USD, witnessed the latter establish a hammer candlestick formation: a bullish signal within the candlestick domain. The daily chart remains languishing beneath late July tops at $1.1909. North of here, buy-stops could fuel moves to prime resistance at $1.2115-1.1990, a place active sellers may reside. The flip side, of course, is a run south back to Quasimodo support at $1.1689. The relative strength index (RSI) recently retested the upper side of the 50.00 centreline. Rebounding from here underpins upside momentum, whereas slipping lower echoes a bearish cue.
For those who read Monday’s technical briefing you may recall the following in regards to H4 and H1 timeframes (italics):
H4 demand at $1.1783-1.1810, as expected, delivered little at the tail end of the week. Prime support inhabits $1.1764-1.1776, with sell-stops beneath the aforementioned demand potentially fuelling willing $1.1764-1.1776 bids. The H1 chart shares a similar energy. The chart’s focus has shifted to $1.18. Although $1.18 joins hands with a 61.8% Fib retracement and a 1.618% Fib projection at $1.1797, Quasimodo resistance-turned support at $1.1775 (unites with prime H4 support at $1.1764-1.1776) is positioned to welcome any $1.18 whipsaw.
As evident from H4 and H1 charts, the whipsaw to both H4 prime support at $1.1764-1.1776 and H1 Quasimodo resistance-turned support at $1.1775 delivered, as anticipated.
Going forward, the next upside objective, according to the technical landscape on the H4 chart, rests at $1.1851-1.1840: a prime resistance zone. In terms of the H1 chart, Quasimodo resistance calls for attention at $1.1841, which aligns with a mild Fibonacci retracement cluster (resistance).
Observed levels – EUR/USD
Yesterday’s hammer candlestick configuration on the daily chart, in addition to the H1 printing a meaningful break above $1.18, casts a bullish light over the market. Couple this with space for buyers to stretch their legs north of $1.18 to H1 Quasimodo resistance at $1.1841 and H4 prime resistance at $1.1851-1.1840, this could be sufficient to inspire a short-term bullish setting above $1.18.
Should the unit rally, H4 sellers will likely be watching $1.1851-1.1840 closely.
AUD/USD
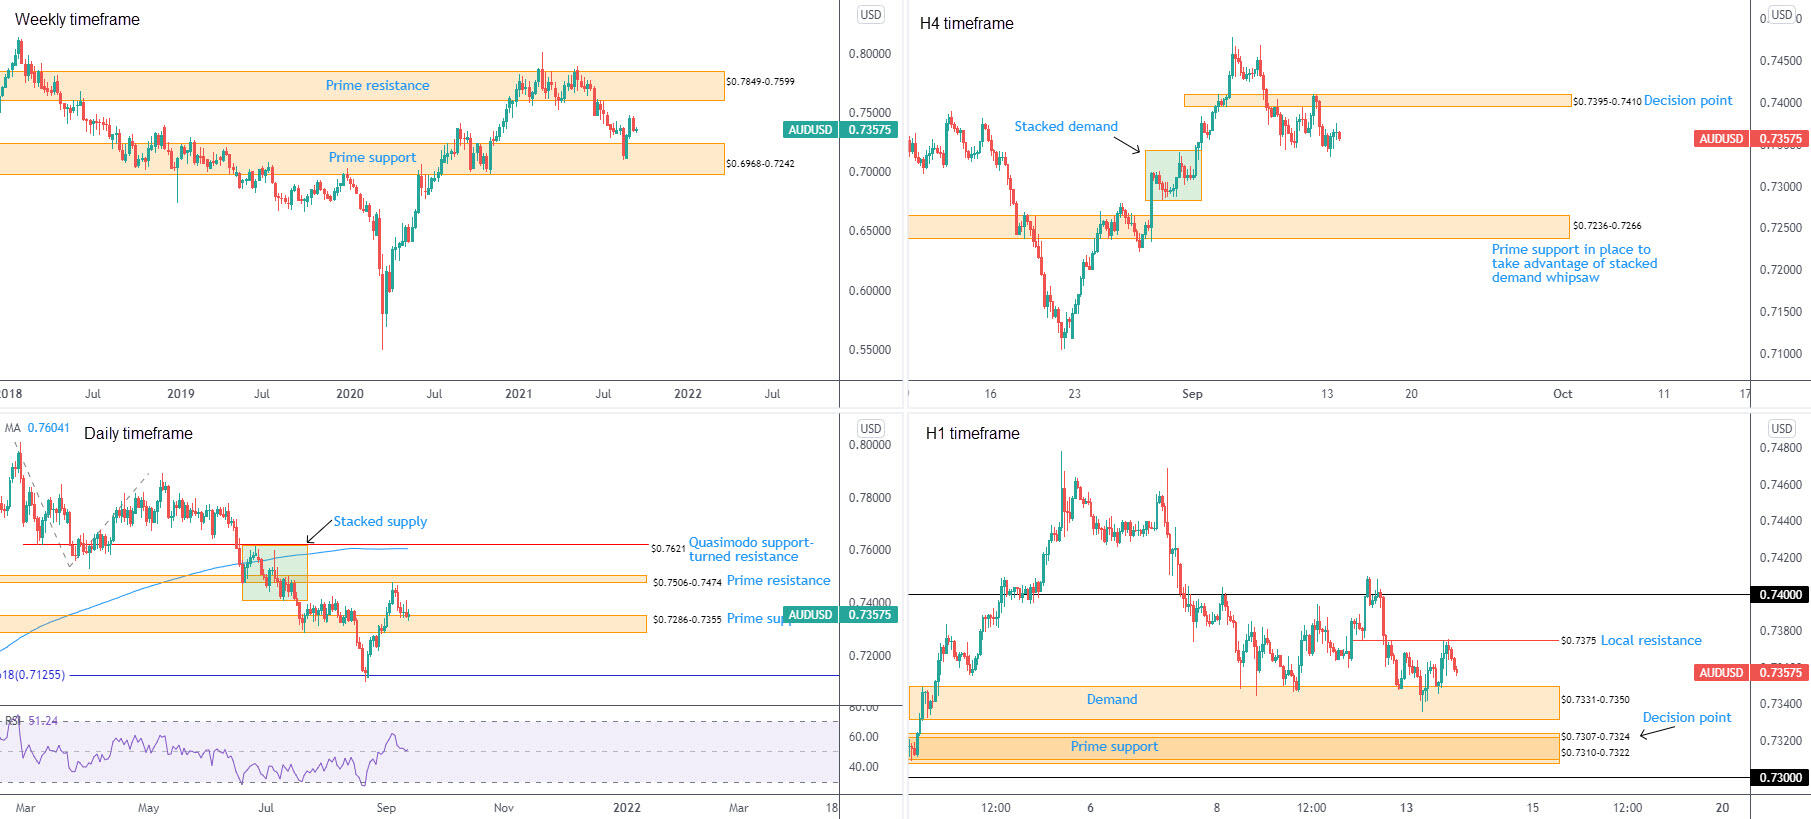
Despite printing solid gains out of prime support at $0.6968-0.7242 on the weekly timeframe, buyers took a back seat last week. Should buyers regain consciousness, prime resistance at $0.7849-0.7599 calls for attention. With respect to trend, we’ve been higher since early 2020. Therefore, the response from $0.6968-0.7242 could be a dip-buying attempt.
In tandem with the weekly picture, prime support on the daily timeframe at $0.7286-0.7355 put in an appearance in the second half of last week. This followed a one-sided drop from prime resistance at $0.7506-0.7474. Although Monday emphasised a muted session, the currency pair eked out modest gains. In the event this fails to spark bullish follow-through, the 1.618% Fib projection calls for action at $0.7126. What’s also interesting is the relative strength index (RSI) retested the 50.00 centreline. Deriving support from this level entertains the idea of positive momentum, yet a break lower underlines a bearish image.
Meanwhile, price movement on the H4 timeframe discovered support from stacked demand between $0.7282 and $0.7343. This followed Friday’s one-way move from the decision point at $0.7395-0.7410. Prime support at $0.7236-0.7266 may interest bullish eyes—a base arranged to receive downside momentum derived from sell-stops below stacked demand.
From a shorter-term perspective, H1 demand at $0.7331-0.7350 remains operational, albeit upside attempts currently hampered by local resistance at $0.7375. Recent selling underscores the possibility of a whipsaw through current demand to prime support at $0.7310-0.7322 (joined by a decision point at $0.7307-0.7324).
Observed levels
Monday taking control of local resistance at $0.7375 on the H1 scale, seats H1 demand at $0.7331-0.7350 on the radar and, by extension, a whipsaw of the area to prime support at $0.7310-0.7322. This is reinforced by prime support on the daily timeframe at $0.7286-0.7355, which houses the H1 prime zone.
USD/JPY
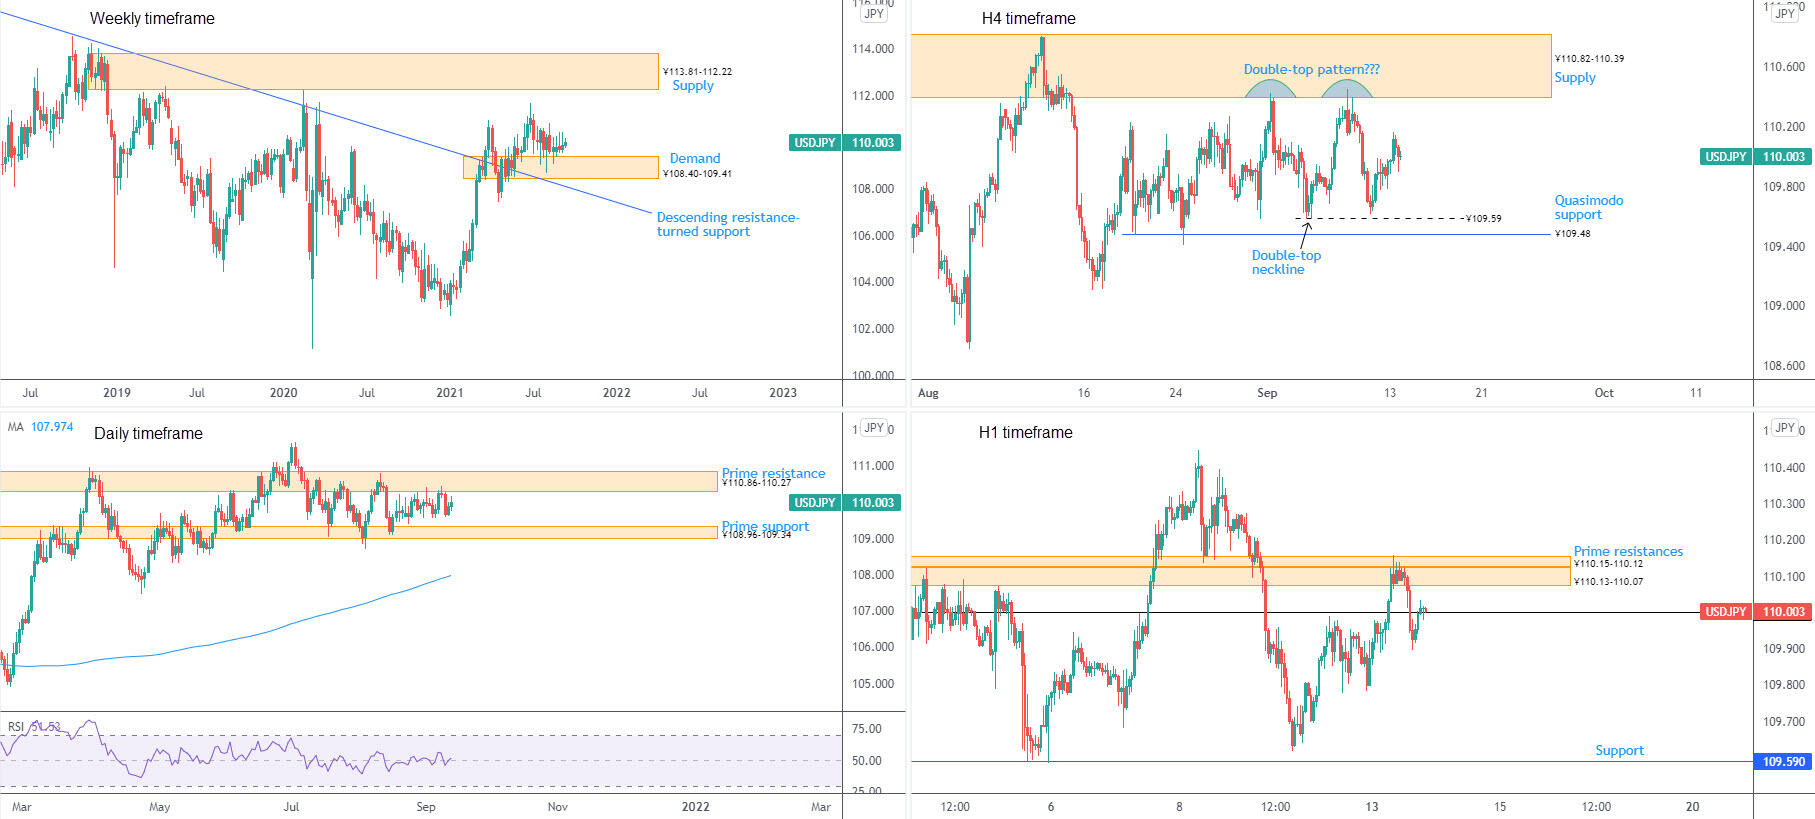
Since mid-July, ¥108.40-109.41 demand has failed to stir much bullish energy on the weekly timeframe. Nevertheless, recognising the area derives additional backing from neighbouring descending resistance-turned support, extended from the high ¥118.61, an advance is likely to welcome familiar supply at ¥113.81-112.22.
The lacklustre vibe out of weekly demand is established through a range on the daily timeframe between prime support at ¥108.96-109.34 and resistance from ¥110.86-110.27. The reluctance to commit outside of these areas toughens the consolidation. Range limits, therefore, are likely to remain on the watchlist.
Relatively large-scale supply exists on the H4 timeframe at ¥110.82-110.39, an area capping upside since mid-July. With this zone making an entrance twice in September thus far and price developing a possible double-top pattern around ¥110.44, a break of the formation’s neckline at ¥109.59 could spark bearish movement. The caveat, of course, is Quasimodo support at ¥109.48. This level—technically speaking—informs traders that a bear trap could be in the making. This means a whipsaw through the neckline (which forms support alongside the ¥109.59 31st August low) may fill sell-stops that subsequently feed ¥109.48 bids.
For those who read Monday’s technical briefing you may recall the following (italics):
The H1 timeframe has ¥110 in sight, an objective base that many traders will be watching early week. The interesting thing here is the prime resistances situated above between ¥110.15-110.12 and ¥110.13-110.07. Round numbers such as ¥110 often attract attention and when coming from below has traders attempting to fade the number and also play any breakout above. With prime resistance located directly higher, this has ‘stop run’ written all over it.
As you can see, Monday did indeed make its way above ¥110 and react from the aforementioned prime resistances. With short-term flow making a stand off ¥109.90 lows, price reclaimed the round number in recent hours and shines light on a possible run above ¥110.15-110.12 to challenge the daily timeframe’s prime resistance at ¥110.86-110.27, followed by the lower edge of H4 prime resistance at ¥110.82-110.39.
Observed levels
If H1 preserves bullish status north of ¥110, keep the possibility of moves to daily prime resistance at ¥110.86-110.27 under watch. The absence of buyers above the round number, on the other hand, sets the stage for a bearish theme to H1 support at ¥109.59 (essentially representing the H4 double-top’s pattern neckline).
GBP/USD
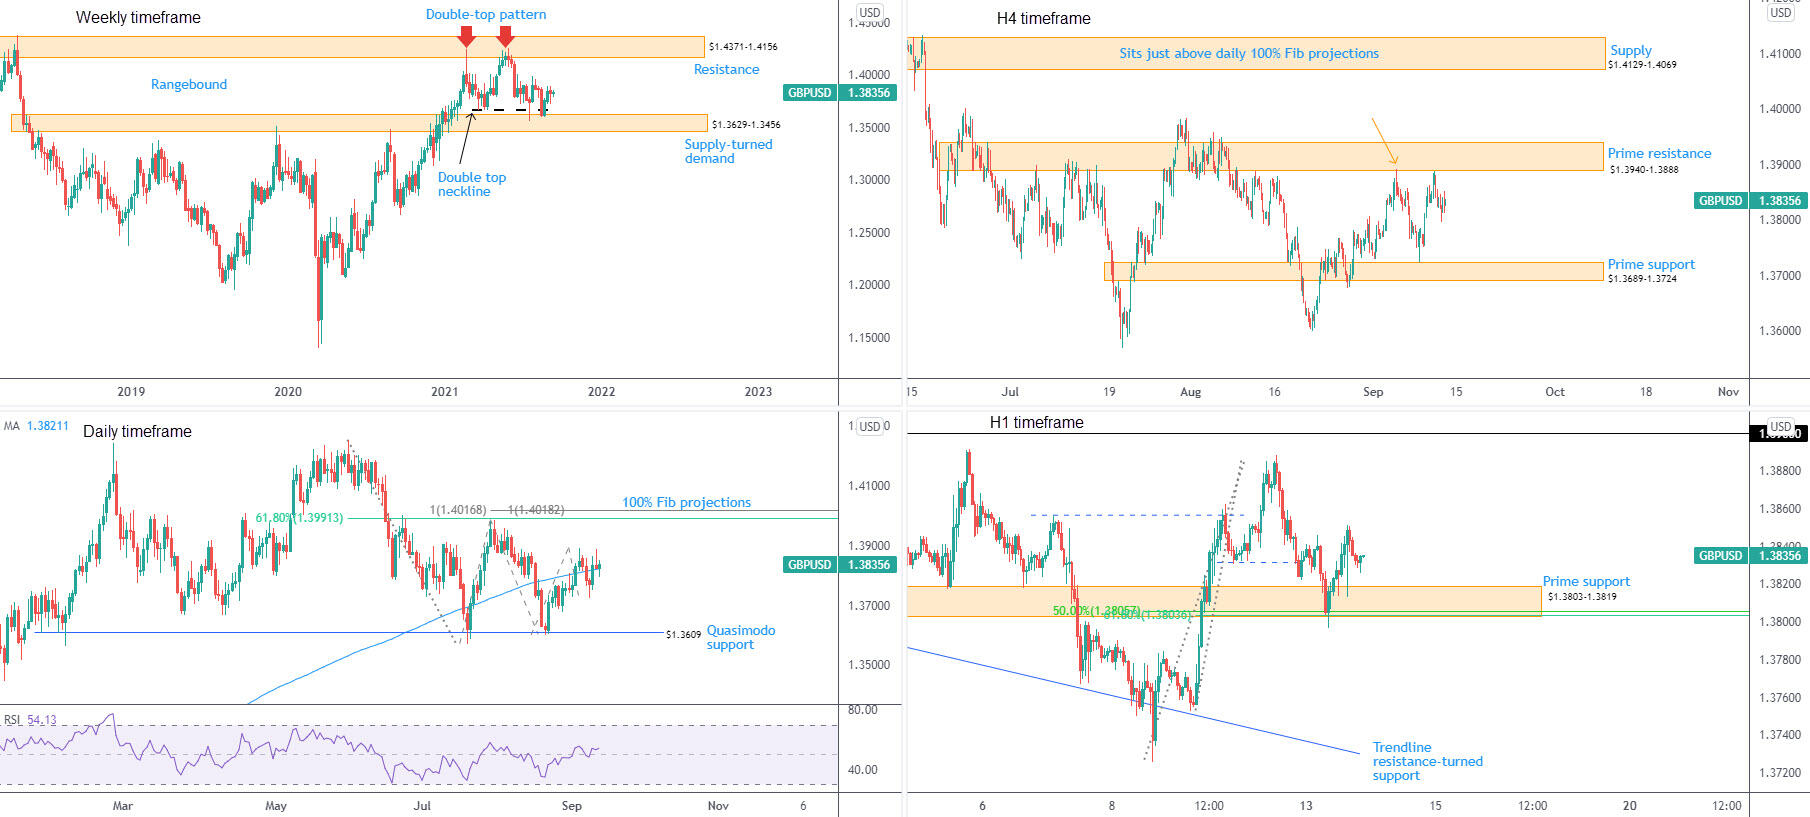
In the shape of a hammer candlestick formation (bullish signal), supply-turned demand at $1.3629-1.3456 on the weekly timeframe stepped forward in July. The aforementioned zone, as you can see, remains active, welcoming an additional test mid-August. Yet, pattern traders will note August’s move closed south of a double-top pattern’s neckline at $1.3664, consequently broadcasting a long-term bearish warning. Conservative pattern sellers, however, are likely to seek a candle close beneath $1.3629-1.3456 before pulling the trigger.
A closer reading of price action on the daily timeframe reveals buyers and sellers have been battling for position around the 200-day simple moving average at $1.3821 since the beginning of September. It was also recently aired in Monday’s technical briefing that the daily chart communicates a rangebound environment. Since late June, buyers and sellers have been squaring off between a 61.8% Fib retracement at $1.3991 and a Quasimodo support from $1.3609. Directly above the consolidation, two tight-knit 100% Fib projections are seen around $1.4017—a double AB=CD bearish configuration for any harmonic traders reading. Momentum studies, according to the relative strength index (RSI), made its way above the 50.00 centreline and retested the barrier: average gains exceed average losses.
As we already highlighted in Monday’s analysis, H4 prime resistance at $1.3940-1.3888 put in another appearance on Friday, forcing buyers to step aside. Although this implies a bearish follow-through—targeting prime support at $1.3689-1.3724—the fact we tested (and possibly weakened) $1.3940-1.3888 early September (orange arrow) might discourage further selling. What’s technically interesting on the H4 scale is above $1.3940-1.3888 we have the upper edge of the daily range at $1.3991 and the 100% Fib projections seen around $1.4017. Understanding this, traders could get the impression a medium-term stop run may materialise, taking stops not only from the H4 prime resistance, but also daily range resistance at $1.3991. The 100% Fib projections, therefore, could be an area we see healthy sellers attack the market from in the near future.
For those who read Monday’s technical briefing you may recall the following (italics):
Leaving $1.39 unchallenged Friday, sterling pared earlier gains off one-week tops versus the greenback. The session wrapped up exploring space south of the $1.3832 low—an important short-term level forming prior to Friday’s high $1.3888. Breaking beneath this has likely tripped intraday sell-stops, which perhaps contain enough fuel to fill bids at prime support from $1.3803-1.3819 early week, with an initial target of $1.3838.
As can be seen from the H1 chart this morning, buyers made an entrance from $1.3803-1.3819 on Monday (albeit clipping the lower side of the base and bringing in Fibonacci support around $1.3803). The initial target of $1.3838 was easily achieved, extending to $1.3851 before easing off.
Observed levels
Observing price movement on the daily timeframe marginally close above the 200-day simple moving average at $1.3821 is action traders perhaps view as an early bullish signal. This, along with what appears a fragile H4 prime resistance at $1.3940-1.3888 and the H1 timeframe showing elbow room to reach $1.39, puts forward a bullish theme. Though before price explores higher levels, a retest of the H1 prime support at $1.3803-1.3819 may come about.
Author

Aaron Hill
FP Markets
After completing his Bachelor’s degree in English and Creative Writing in the UK, and subsequently spending a handful of years teaching English as a foreign language teacher around Asia, Aaron was introduced to financial trading,


