USD/JPY Elliott Wave technical analysis [Video]
![USD/JPY Elliott Wave technical analysis [Video]](https://editorial.fxstreet.com/images/Markets/Currencies/Majors/USDJPY/japanese-currency-16048717_XtraLarge.jpg)
USD/JPY Elliott Wave technical analysis
-
Function: Bullish Trend.
-
Mode: Impulsive.
-
Structure: Orange Wave 5.
-
Position: Navy Blue Wave 1.
-
Direction (next lower degrees): Navy Blue Wave 2.
-
Details: Orange Wave 4 appears completed; Orange Wave 5 of 1 is underway.
-
Wave cancel invalidation level: 152.327.
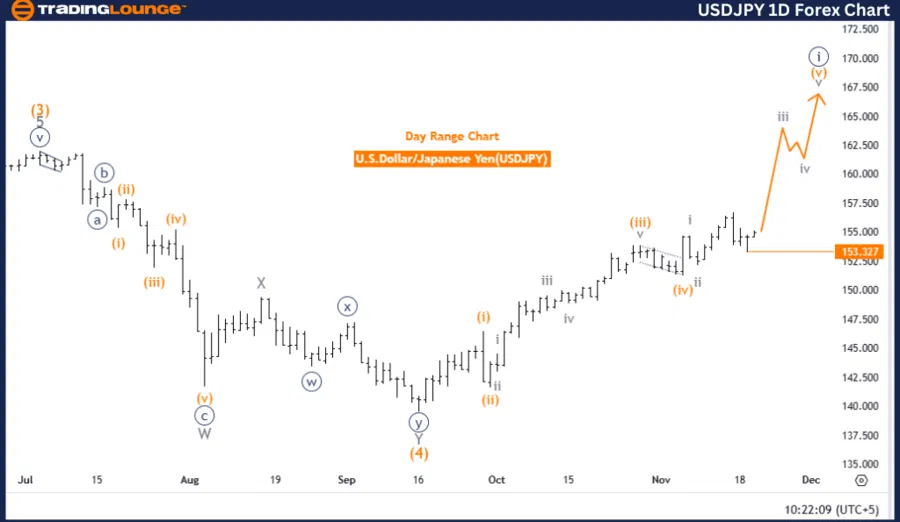
The USDJPY daily chart analysis provided by Trading Lounge showcases a bullish trend highlighted by an impulsive wave structure. Currently, the focus is on orange wave 5, part of navy blue wave 1, indicating an ongoing upward movement within the Elliott Wave framework.
Orange wave 4 appears to have reached completion, setting the stage for orange wave 5 of navy blue wave 1 to progress. This development signifies sustained bullish momentum, as wave 5 typically represents the final thrust in an impulsive sequence before transitioning into a corrective phase.
Upon completion of orange wave 5, the next anticipated phase is navy blue wave 2, which aligns with the Elliott Wave principle. This principle describes market behavior as alternating between impulsive and corrective phases to form cyclical structures.
A critical invalidation level has been established at 152.327. Should the price retrace to or below this level, the current wave count will be invalidated, suggesting a potential alteration in the market's trend or structure. This level acts as a key reference point for assessing wave accuracy and managing trading risks.
Summary
The USDJPY daily chart indicates a bullish trend, with orange wave 5 of navy blue wave 1 currently active following the completion of orange wave 4. The market is poised for further advancement within this wave, in line with the impulsive trend. Traders are advised to monitor the invalidation level at 152.327 to validate the wave structure and align trading strategies with the bullish outlook.
USD/JPY day chart
USD/JPY Elliott Wave technical analysis
-
Function: Bullish Trend.
-
Mode: Impulsive.
-
Structure: Gray Wave 3.
-
Position: Orange Wave 5.
-
Direction (next lower degrees): Gray Wave 4.
-
Details: Gray wave 2 appears completed; Gray wave 3 is currently unfolding.
-
Wave cancel invalidation level: 152.327.
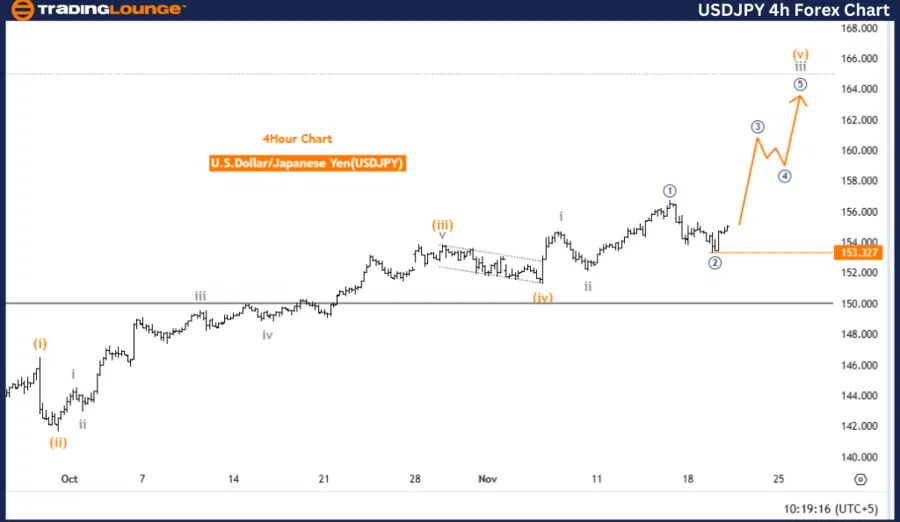
The USDJPY 4-hour chart analysis by Trading Lounge highlights a bullish trend within the Elliott Wave framework. The chart focuses on the ongoing development of gray wave 3, an impulsive wave in the broader upward progression. The current wave structure resides within orange wave 5, signifying continued advancement within gray wave 3.
The analysis indicates that gray wave 2 appears to have concluded, allowing gray wave 3 to progress. This movement reflects a continuation of upward momentum, as wave 3 is typically the most dynamic and extended phase in an impulsive wave sequence.
The wave sequence anticipates the next phase—gray wave 4—which is expected to emerge following the completion of gray wave 3. This transition aligns with the Elliott Wave principle, where corrections alternate with impulsive moves to maintain the cyclical nature of the market.
A critical invalidation level is set at 152.327. If the price retraces to or below this level, the current wave count will be invalidated, signaling a possible shift in market trend or structure. This level acts as a crucial benchmark for assessing wave analysis accuracy and managing trading risks.
Summary
The USDJPY 4-hour chart illustrates a bullish trend, with gray wave 3 actively unfolding after the completion of gray wave 2. The market is advancing within orange wave 5, consistent with the impulsive characteristics of wave 3. Traders should closely monitor the invalidation level at 152.327 to confirm the wave structure and align trading strategies with the projected bullish trend continuation.
USD/JPY four-hour chart
USD/JPY Elliott Wave technical analysis [Video]
Author

Peter Mathers
TradingLounge
Peter Mathers started actively trading in 1982. He began his career at Hoei and Shoin, a Japanese futures trading company.


