USD/JPY Elliott Wave technical analysis [Video]
![USD/JPY Elliott Wave technical analysis [Video]](https://editorial.fxstreet.com/images/Markets/Currencies/Majors/USDJPY/japanese-yen4_XtraLarge.jpg)
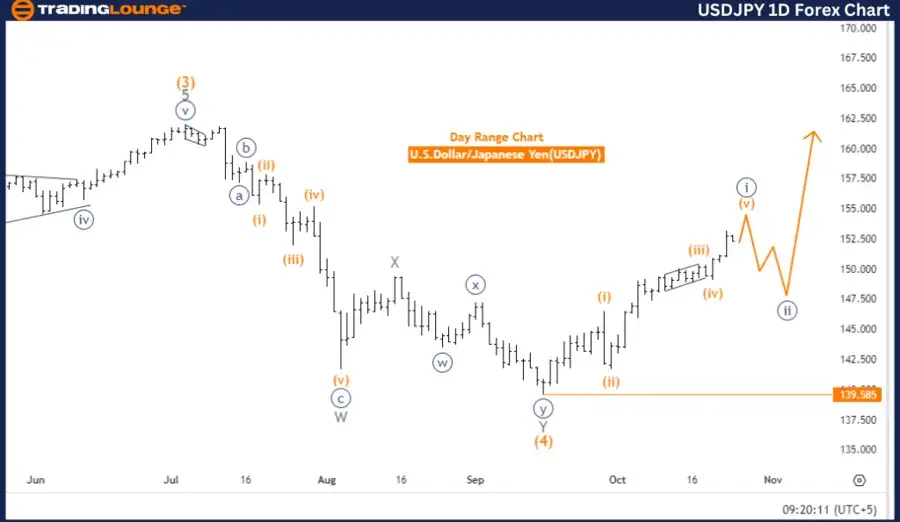
U.S. Dollar/Japanese Yen (USDJPY) Day Chart.
USD/JPY Elliott Wave technical analysis
-
Function: Trend.
-
Mode: Impulsive.
-
Structure: Navy Blue Wave 1.
-
Position: Gray wave 1.
-
Direction next lower degrees: Navy blue wave 2.
-
Details: Navy Blue Wave 1 is in progress and appears to be nearing its completion.
-
Wave cancel invalidation level: 139.585.
The Elliott Wave analysis for USDJPY on the daily chart shows an impulsive trend currently underway. The focus is on navy blue wave 1, which is unfolding as the first leg of the trend. The currency pair is positioned within gray wave 1, indicating that the initial phase of this impulsive cycle is still active.
As navy blue wave 1 nears completion, the market is expected to shift into a corrective phase, represented by navy blue wave 2. This signals a potential slowdown in the strong upward trend, with a possible pullback or correction anticipated in the near term. The forthcoming wave 2 will likely act as a consolidation before the trend resumes its bullish direction.
It's important to keep in mind the wave cancel invalidation level at 139.585. If the price drops below this level, the current Elliott Wave count will be invalidated, necessitating a re-evaluation of the market structure. As long as this level holds, the impulsive structure remains valid, and further upward movement could occur once wave 2 completes.
Traders and analysts will closely monitor the development of navy blue wave 1 as it nears completion. Signs of the transition into wave 2 could bring temporary downward pressure on the USDJPY pair.
In summary, the USDJPY daily Elliott Wave analysis indicates that navy blue wave 1 is nearing its conclusion, with a corrective navy blue wave 2 expected to follow. The critical invalidation level for this wave count is set at 139.585, and this level will determine whether the current structure holds or requires adjustment.
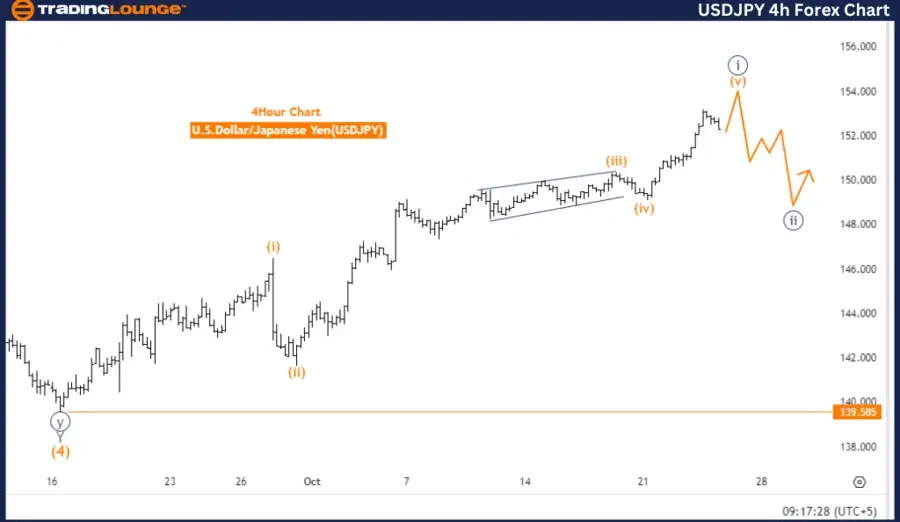
U.S. Dollar/Japanese Yen (USDJPY) 4 Hour Chart.
USD/JPY Elliott Wave technical analysis
-
Function: Trend.
-
Mode: Impulsive.
-
Structure: Navy Blue Wave 1.
-
Position: Gray wave 1.
-
Direction next lower degrees: Navy blue wave 2.
-
Details: Navy Blue Wave 1 is active and appears to be nearing its completion.
-
Wave cancel invalidation level: 139.585.
The Elliott Wave analysis for USDJPY on the 4-hour chart reveals that the market is currently in an impulsive trend. The analysis is centered on the development of navy blue wave 1, which forms part of a larger impulsive structure. At this stage, the pair is positioned in gray wave 1, signifying that the first wave of the current cycle is progressing.
Navy blue wave 1 is nearing completion, which indicates the market may soon enter a corrective phase, known as navy blue wave 2. The conclusion of navy blue wave 1 will signal the end of this initial upward movement, leading to a pullback or correction as wave 2 develops. This correction is typical in the Elliott Wave cycle, where impulsive moves are followed by corrective phases before the trend resumes.
The key observation in this analysis is that navy blue wave 1 is still unfolding and approaching its end. Traders and analysts will be on alert for signs that this wave is concluding, as it will signal the beginning of wave 2, potentially bringing a temporary price retracement.
The wave cancellation invalidation level is set at 139.585. Should the price fall below this threshold, the current wave count would be invalidated, requiring a reassessment of the market's structure.
In conclusion, the 4-hour USDJPY Elliott Wave analysis indicates that navy blue wave 1 is in progress and nearing completion. The market is expected to transition into navy blue wave 2 shortly, which will be a corrective phase. The critical invalidation level remains 139.585, and traders should watch this level closely to confirm or invalidate the current wave structure.
Technical analyst: Malik Awais.
USD/JPY Elliott Wave technical analysis [Video]
Author

Peter Mathers
TradingLounge
Peter Mathers started actively trading in 1982. He began his career at Hoei and Shoin, a Japanese futures trading company.


