USD/JPY Creates 250 Pip Surge in Bullish Wave 3

the USD/JPY made a massive bullish breakout. The impulsive price action is typical for a wave 3 (green). More bullish swings are likely to follow.
4 hour chart
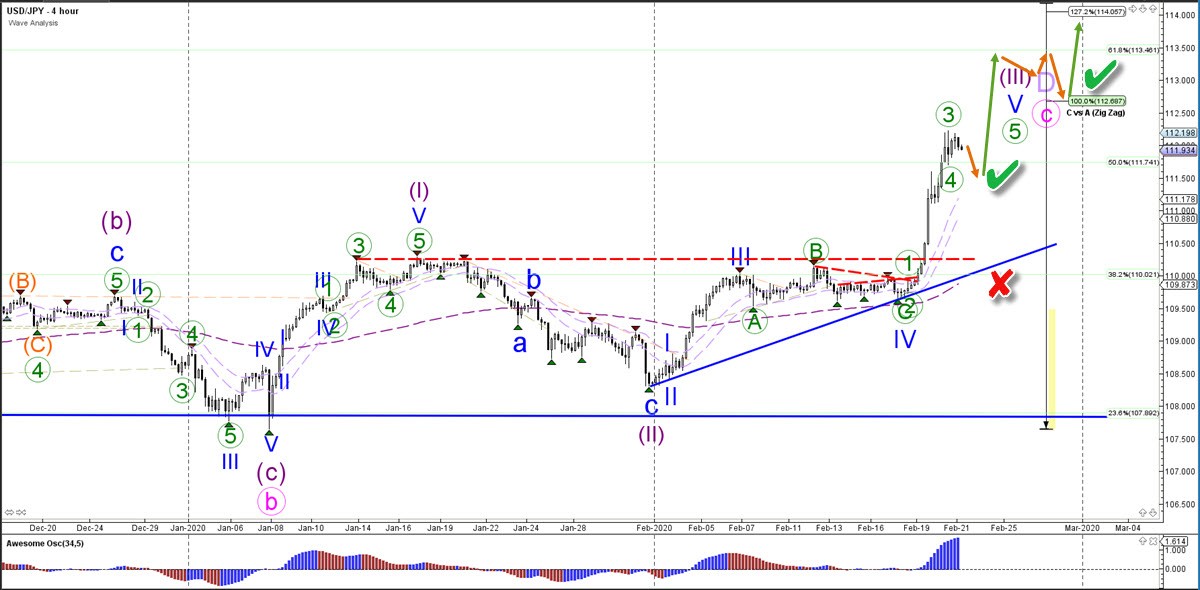
The USD/JPY has strongly moved away from the 21 ema zone as our previous wave analysis expected. Price will probably bounce at the support (green check) for a move higher. The main targets levels are the Fibonacci levels of wave C vs A (pink) and the wave D (purple). Only a deep retracement would invalidate (red x) the bullish outlook.
1 hour chart
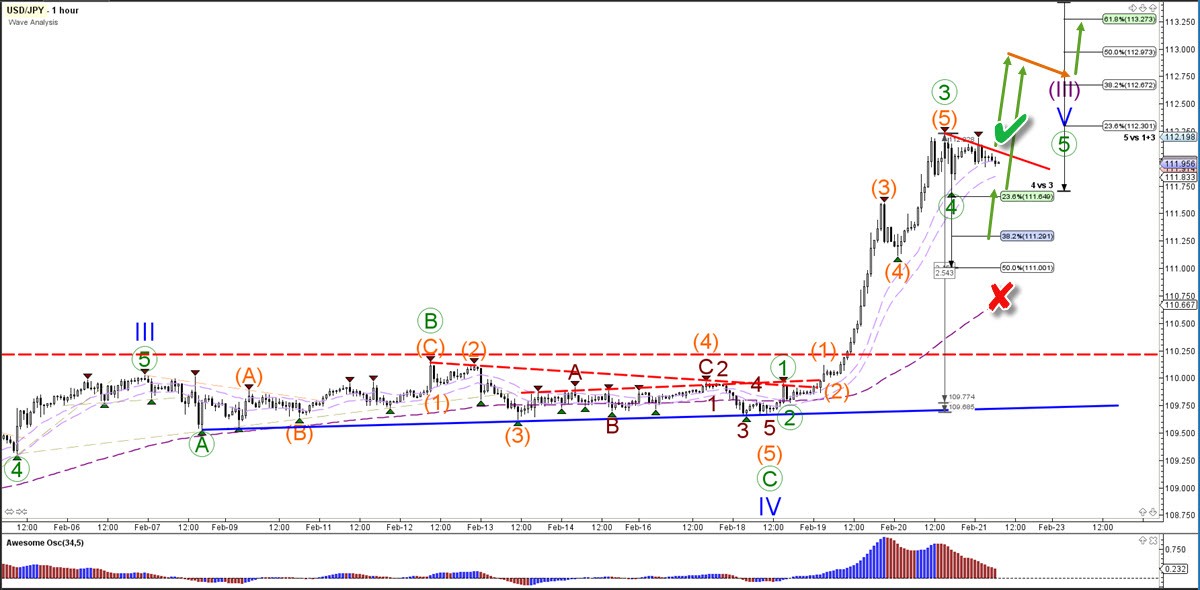
The USD/JPY has moved up in 5 strong waves (green). This seems to complete a wave 3 (green) pattern. Now price could build a shallow pullback for a wave 4 (green). A breakout or bounce could confirm (green check) the uptrend continuation towards the Fib targets. A break below the 50% Fib invalidates (red x) the wave 4.
The analysis has been done with the CAMMACD.Core System.
For more daily technical and wave analysis and updates, sign-up up to our ecs.LIVE channel.
Author

Chris Svorcik
Elite CurrenSea
Experience Chris Svorcik has co-founded Elite CurrenSea in 2014 together with Nenad Kerkez, aka Tarantula FX. Chris is a technical analyst, wave analyst, trader, writer, educator, webinar speaker, and seminar speaker of the financial markets.


