USD/JPY Choppy Trading Continues - Symmetric Triangle Trade Setup

During the Asian markets, the USD/JPY closed at 108.604 after placing a high of 108.737 and a low of 108.344. Overall the movement of the pair remained bullish.
The Dollar-Yen pair edged high after the news came in that the Phase-one deal of US & China trade deal may not be completed this year. This news indicated the need for safe-haven and possibility of another hike in tariffs.
On Wednesday, Reuters reported that completion of Phase-one of the US-China Trade deal could slip into next year because of increased tension between both countries. The US has threatened China to impose more tariffs on Chinese goods if they do not sign the Phase-one deal by mid- December.
The threat came after when China demanded tariff rollback as part of the phase-one deal, but Trump denied, and China showed reluctance to sign the phase-one agreement.
-637099478105114264.png)
The USD/JPY continues trading sideways at 108.650, staying below the 50 periods EMA resistance level of 108.700. On the 240 minutes chart, the pair has formed a symmetric triangle pattern, which is suggesting chances of bullish or a bearish breakout in USD/JPY. The pair can break either side, depending upon fundamental release.
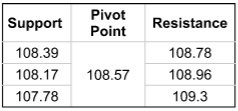
The USD/JPY has immediate support around 108.300, and violation of this can trigger sell-off until 108.
USD/JPY - Trade Setup
1) Buy Above 108.350
Take Profit 108.650
Stop Loss 108.050
2) Sell Below 108.750
Take Profit 108.350
Stop Loss 109.050
Author

EagleFX Team
EagleFX
EagleFX Team is an international group of market analysts with skills in fundamental and technical analysis, applying several methods to assess the state and likelihood of price movements on Forex, Commodities, Indices, Metals and


