USD/JPY Bearish Wave 4 Prepares for Uptrend Above 110

The USD/JPY is building a minor and shallow pullback at the previous top. The wave patterns indicate a potential bearish ABC (green) for a strong move higher.
4 hour chart
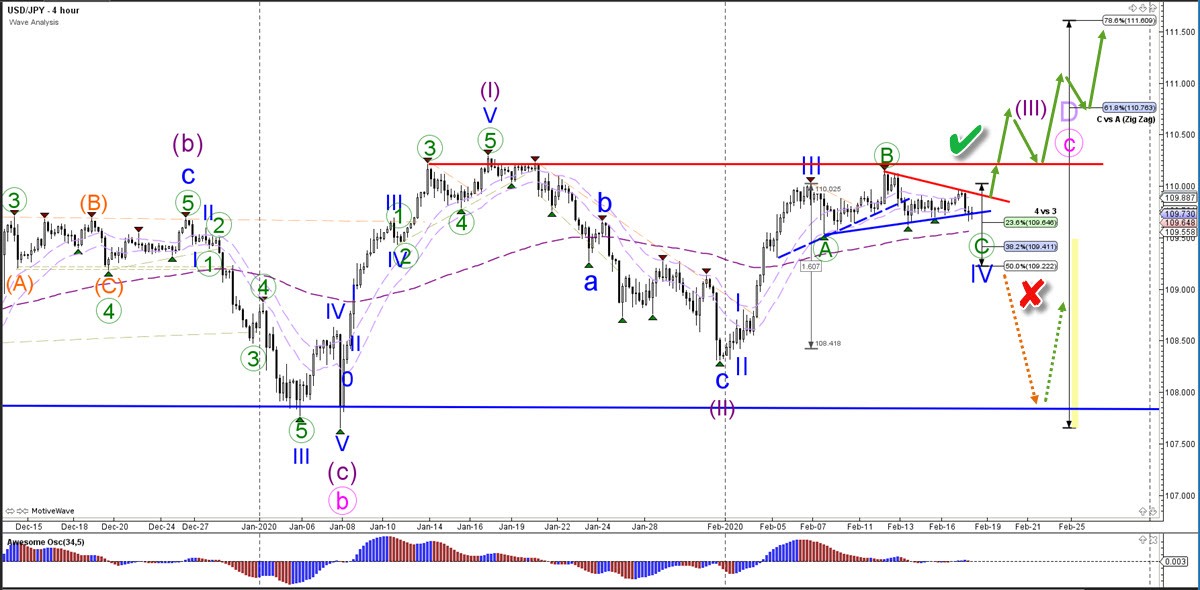
The USD/JPY needs to break above the top (red) before a larger bullish trend continuation can be confirmed (green check). The main targets are the Fibonacci targets of wave C vs A. A break below the 50% Fib invalidates (red x) the expected wave 4 (blue) pattern.
1 hour chart
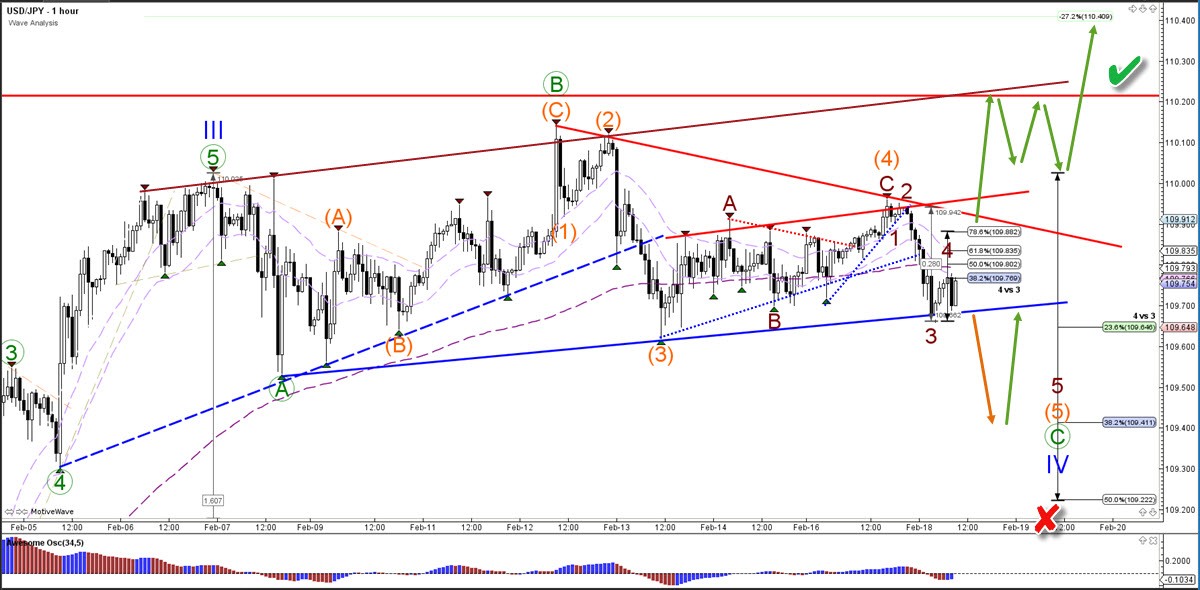
The USD/JPY is building a lengthy correction, which is typical for a wave 4 (blue). But the consolidation zone seems almost over, if indeed the wave C (green) pattern is complete. One last bearish push could send the USD/JPY lower towards the Fibonacci retracement of wave 4 vs 3 if price breaks below the support line (blue). A break above the resistance zone (red), however, could indicate the start of an uptrend.
The analysis has been done with the CAMMACD.Core System.
For more daily technical and wave analysis and updates, sign-up up to our ecs.LIVE channel.
Author

Chris Svorcik
Elite CurrenSea
Experience Chris Svorcik has co-founded Elite CurrenSea in 2014 together with Nenad Kerkez, aka Tarantula FX. Chris is a technical analyst, wave analyst, trader, writer, educator, webinar speaker, and seminar speaker of the financial markets.


