USD/JPY anticipated to add to recovery gains

It was quite the week for the USD/JPY, notching up a fourth consecutive negative week, down -1.2%. This follows November’s bearish showing (-2.3%), which snapped a three-week winning streak. Despite this, it is important to note that the currency pair remains entrenched in a long-term uptrend.
Monthly support in play
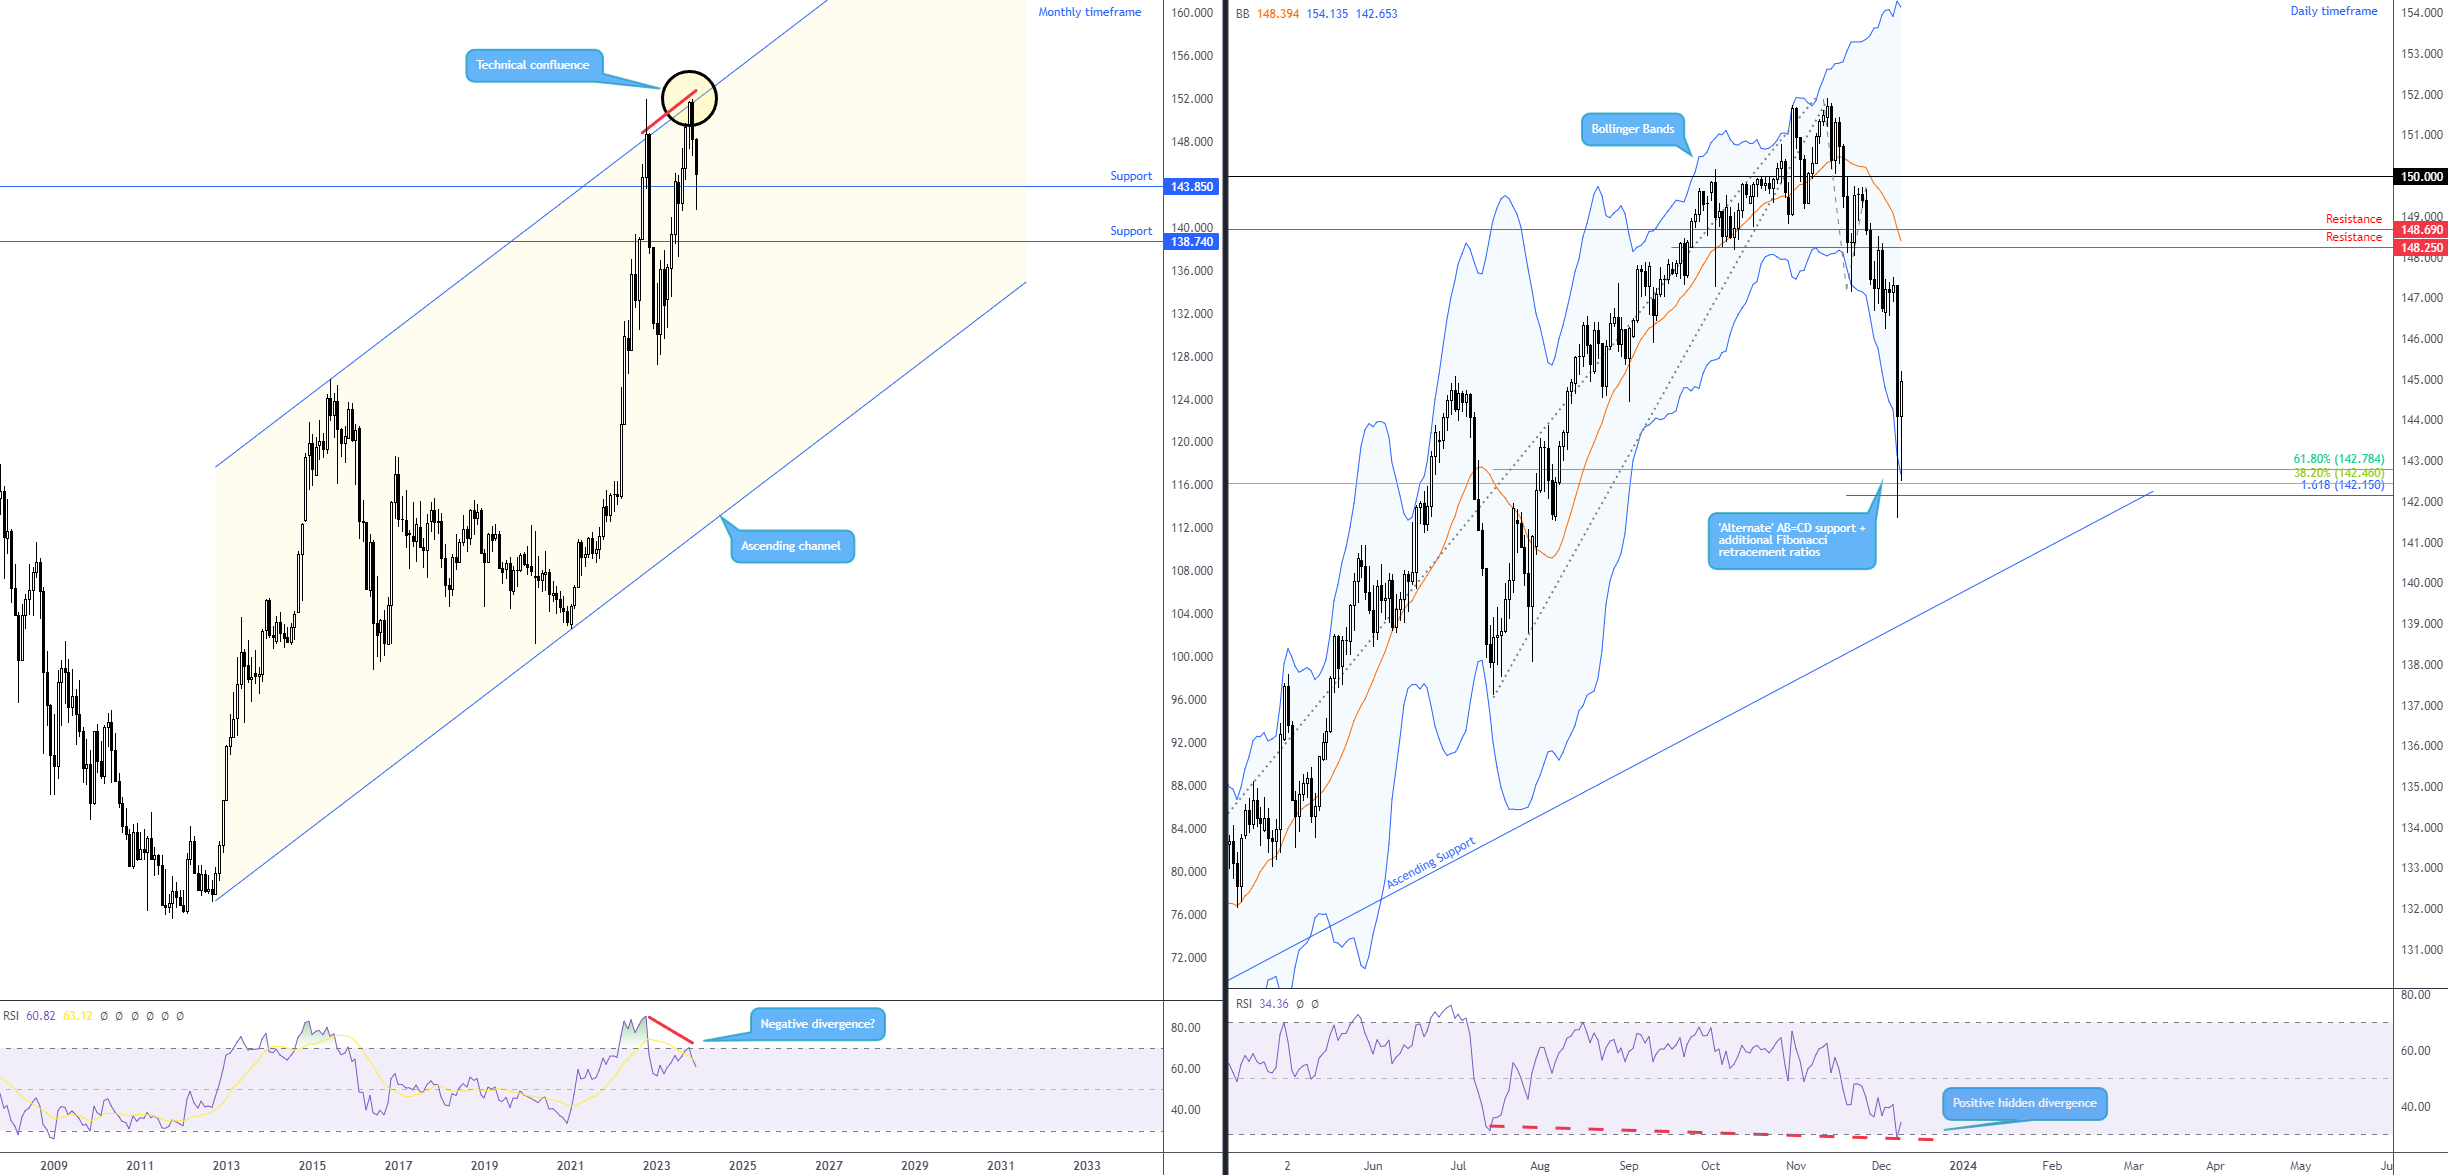
Technically, the recent downside move is unlikely to raise many eyebrows. Longer-term chart studies for the currency pair have been widely followed by the FP Markets Research Team for some time for a good reason. As evident from the monthly chart, price connected with channel resistance taken from the high of ¥125.86 in October. Note this barrier was also tested in October 2022 and sparked a rather meaningful correction to a low of ¥127.22 at the beginning of 2023. The point of note here, nevertheless, is that the most recent test of the monthly channel resistance was joined by negative divergence from the Relative Strength Index (RSI) from the overbought territory on the monthly chart.
The recent bout of selling has also led the currency pair to a noted support level on the monthly scale at ¥143.85. Critically, if the unit overpowers bids at this technical support, this could bring another layer of monthly support to light as far south as ¥138.74.
Daily support area offers noteworthy confluence
On the daily timeframe, Thursday’s sizeable move lower thumped into an area of support between ¥142.15 and ¥142.78: made up of an ‘alternate’ AB=CD support derived from the 1.618% Fibonacci projection ratio, as well as 38.2% and 61.8% Fibonacci retracement ratios. Also of technical importance, not only does this area boast a connection with monthly support addressed above at ¥143.85 and has responded from the lower daily Bollinger Band (set to three standard deviations based on a 20-period simple moving average), but the daily RSI has also aided the area by registering an oversold signal and printing hidden positive divergence (price essentially leads the way rather than the indicator, as you would see with a regular divergence).
USD/JPY this week?
Friday’s meaningful rebound from the daily support area at ¥142.15-¥142.78, together with noted confluence and the longer-term trend pointing to the upside, could be enough (technical) evidence to propel a bullish assault back in the direction of daily resistances at ¥148.25 and ¥148.69.
Source: TradingView
Author

Aaron Hill
FP Markets
After completing his Bachelor’s degree in English and Creative Writing in the UK, and subsequently spending a handful of years teaching English as a foreign language teacher around Asia, Aaron was introduced to financial trading,

















