USD/JPY and BoJ interest rates

USD/JPY 5 year average = 120.79 and 10 year = 116.33. The 138.00 target as specified is a great target but leaves USD/JPY slightly overbought. The target at 137.15 is a much better target. The base for USD/JPY stands at 127.58 taking into account averages from 148.00 to 106.00’s.
USD/JPY remains massively overbought from the 50 day average, 78 day and many averages dating to 1999. USD/JPY trades overbought to the 5, 10 and 14 year averages.
The current driver to USD/JPY is the 78 day average. USD/JPY lower must break 148.65. As USD/JPY failed to break lower, bounces higher from 149.00’s is the result of 149.73 and 149.18. On every model, 149.00’s becomes oversold.
USD/JPY Upper Levels and short points for today: 150.52, 150.62, 150.71, 150.81, 150.90, 151.00, 151.09, 151.19
For the next weeks, USD /JPY will trade as follows:
Above = 151.36, 151.18, 150.82, 150.58, 150.27, 150.03. Below = 149.67, 149.49, 148.62, 147.40
Below : 149.67, 149.49, 148.62, 147.40
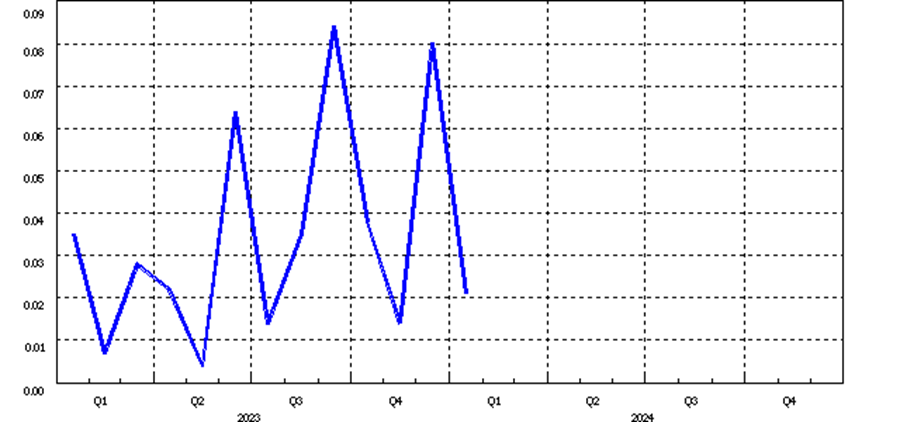
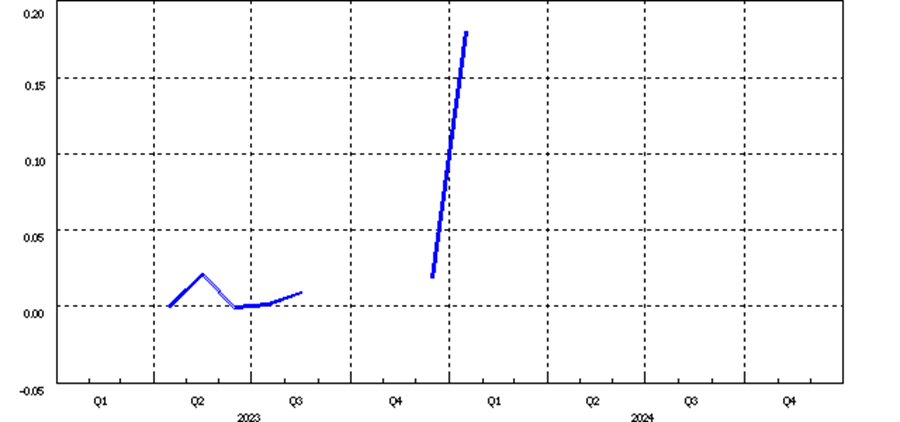
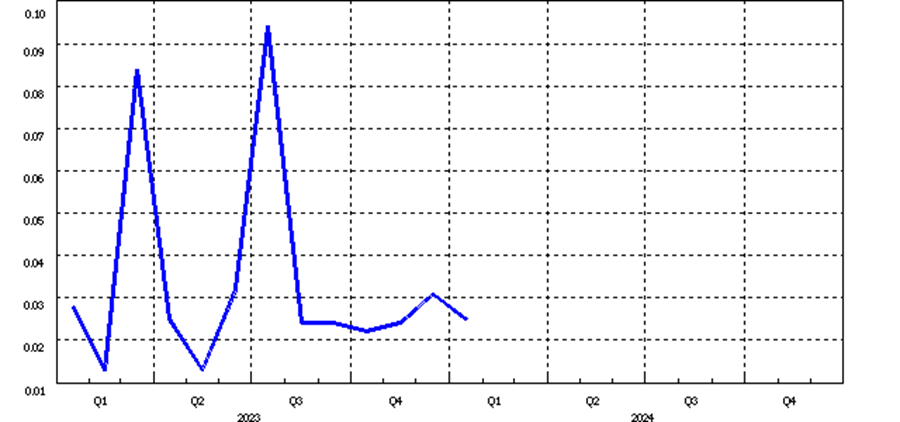
Below are graphs to BOJ monthly average Interest rates from 1 month, 2 months and 3 months to cover 2023 to 2024.
Note the 2 month average in proximity to the 78 day average.
One month
Two months
Three months
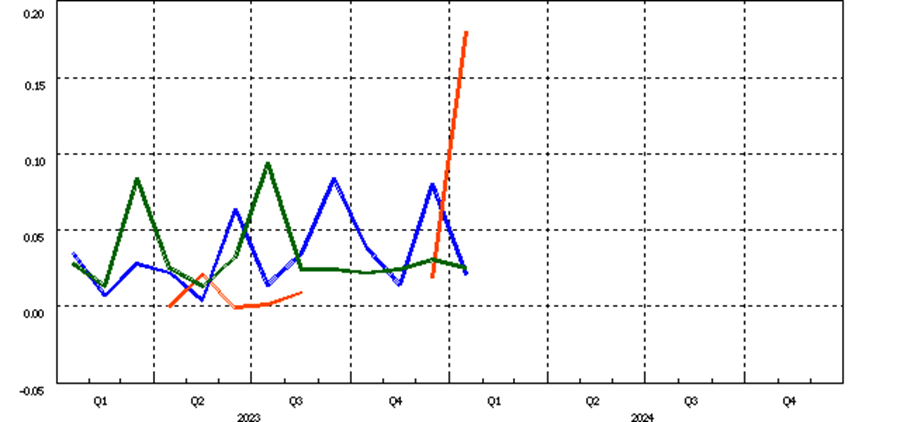
Monthly averages: One, two and three months
Blue = 1 Month, Orange = 2 month, Green = 3 month.
Author

Brian Twomey
Brian's Investment
Brian Twomey is an independent trader and a prolific writer on trading, having authored over sixty articles in Technical Analysis of Stocks & Commodities and Investopedia.


