USD/DKK 1H Chart: Falling Wedge

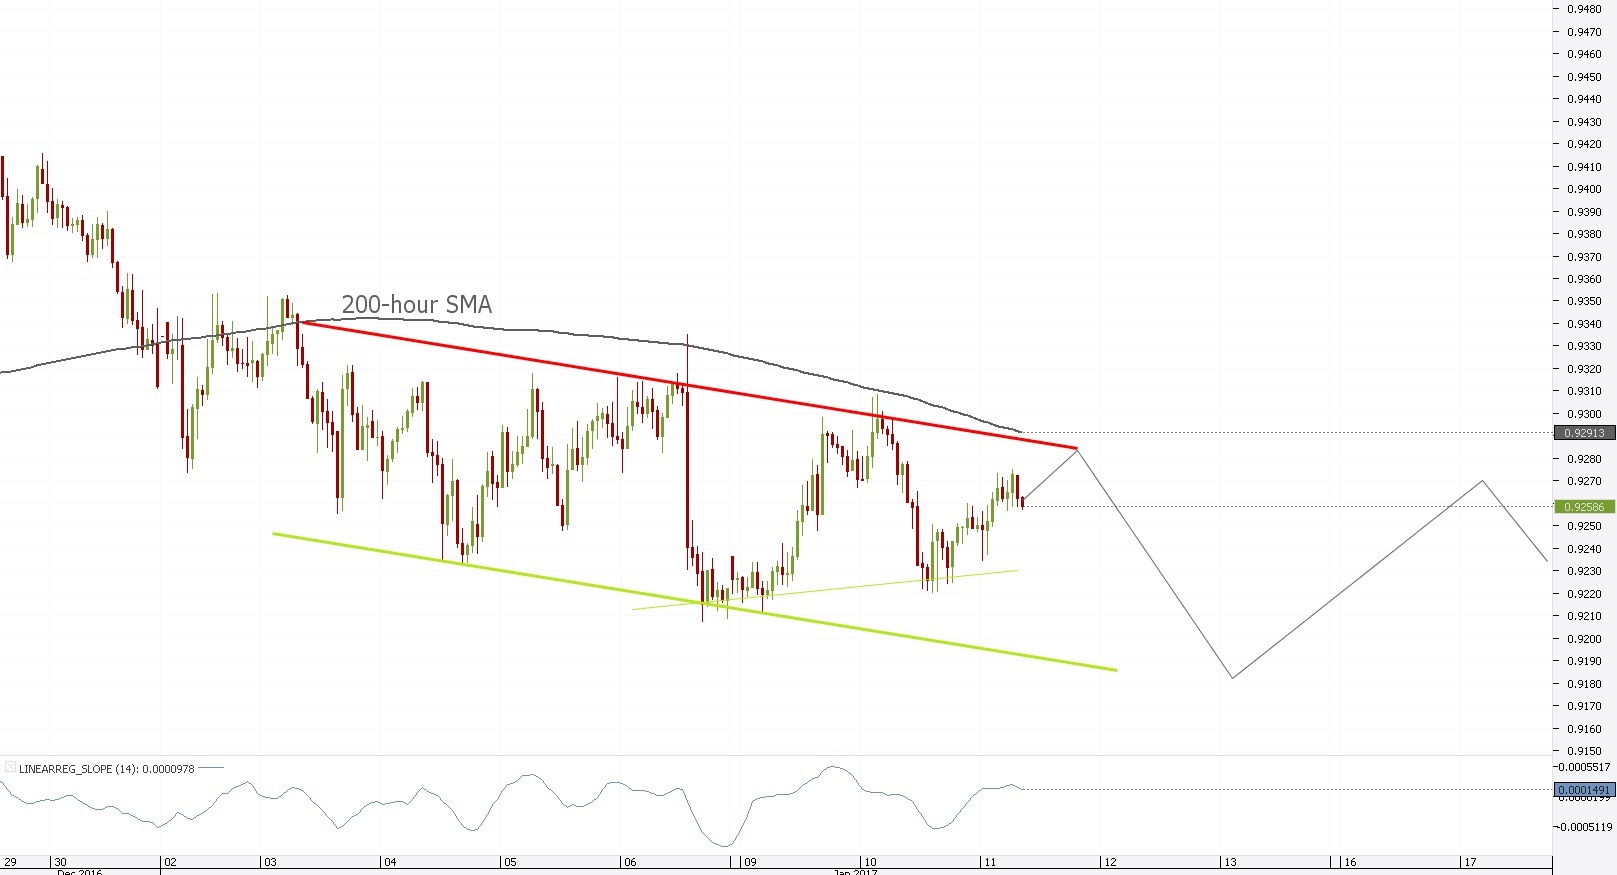
NZD/CAD 1H Chart: Channel Down
Comment: October came with a leap above all time highs of 0.9839, but also set the pair up for a downfall, which has recently taken the form of a descending channel pattern. NZD/CAD is currently squeezed in between several levels of significance amid attempts to break above a green Ichimoku cloud resistance area. The ultimate target of the current motion lies around 0.9286, the upper boundary of the pattern, and is most likely to cause a bounce and initiate a wave south. The scenario is consistent with the symmetrical triangle sketched over the last few waves, and a fail at the aforementioned channel boundary would confirm its credibility.
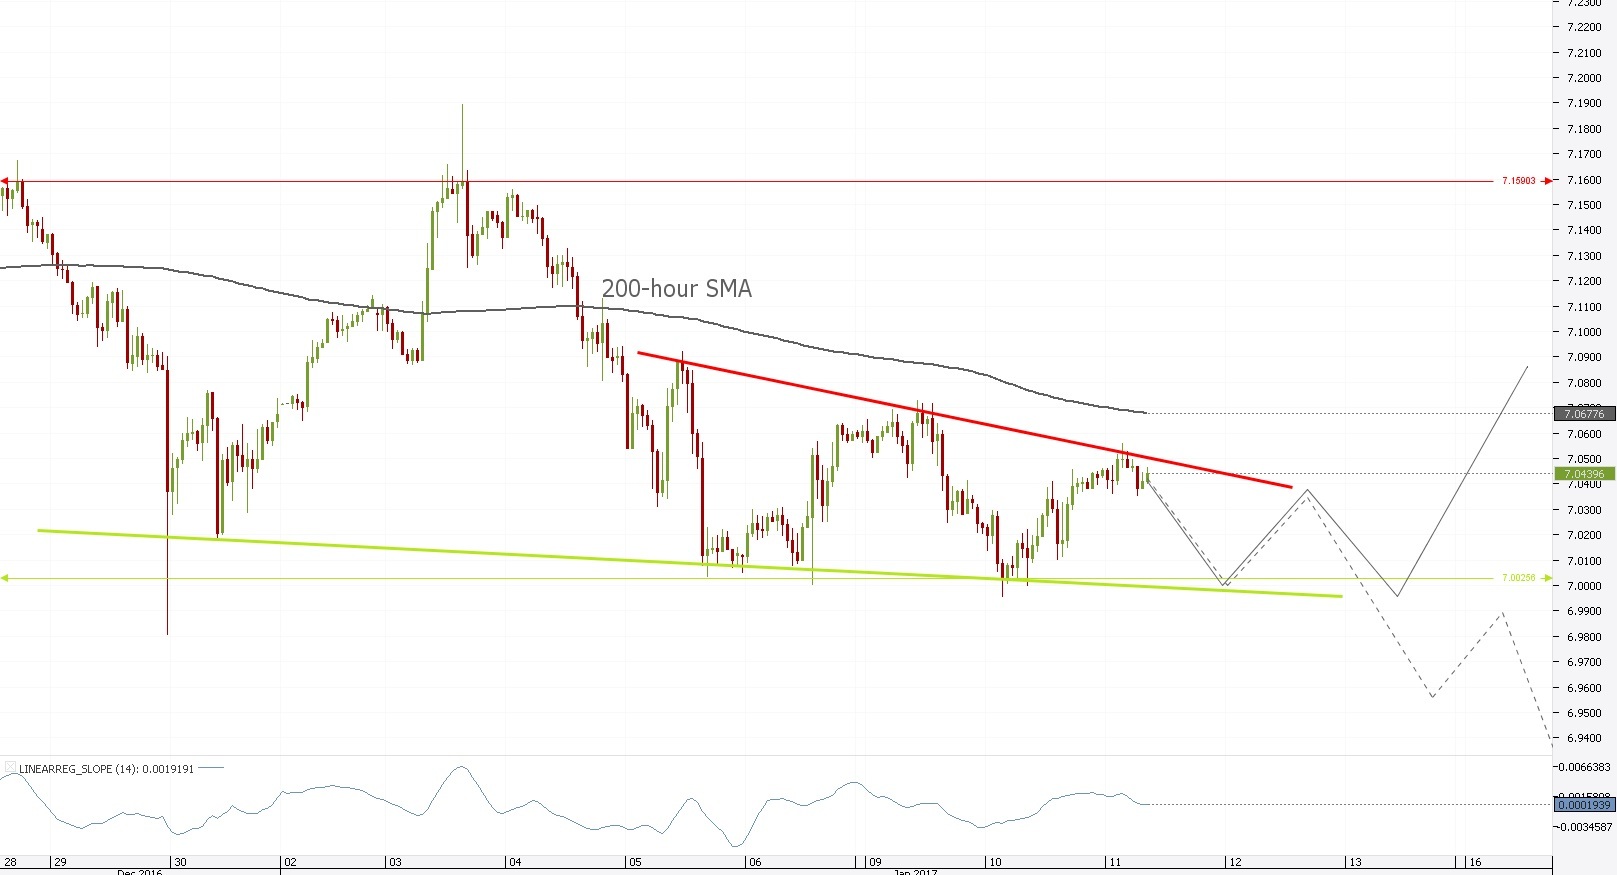
USD/DKK 1H Chart: Falling Wedge
Comment: USD/DKK had never seen levels as high as in December 2016, when the pair attacked 7.1583 for two consecutive times, failing just after, but keeping the bullish potential in the back of its head. A rising wedge now suggests that the area is not out of reach, meaning that a bullish outburst might come in case of stickiness at the upper trend-line. The pair has just tapped at the aforementioned boundary and could either go on to an upward breakout or a downfall below the pattern after a few waves. We will therefore look at 7.0026, which serves as support for an alternative descending triangle pattern and could give us signals on whether an upward or downward breakout is about to take place.
Author

Dukascopy Bank Team
Dukascopy Bank SA
Dukascopy Bank stands as an innovative Swiss online banking institution, with its headquarters situated in Geneva, Switzerland.


