USD consolidates in small triangle pattern

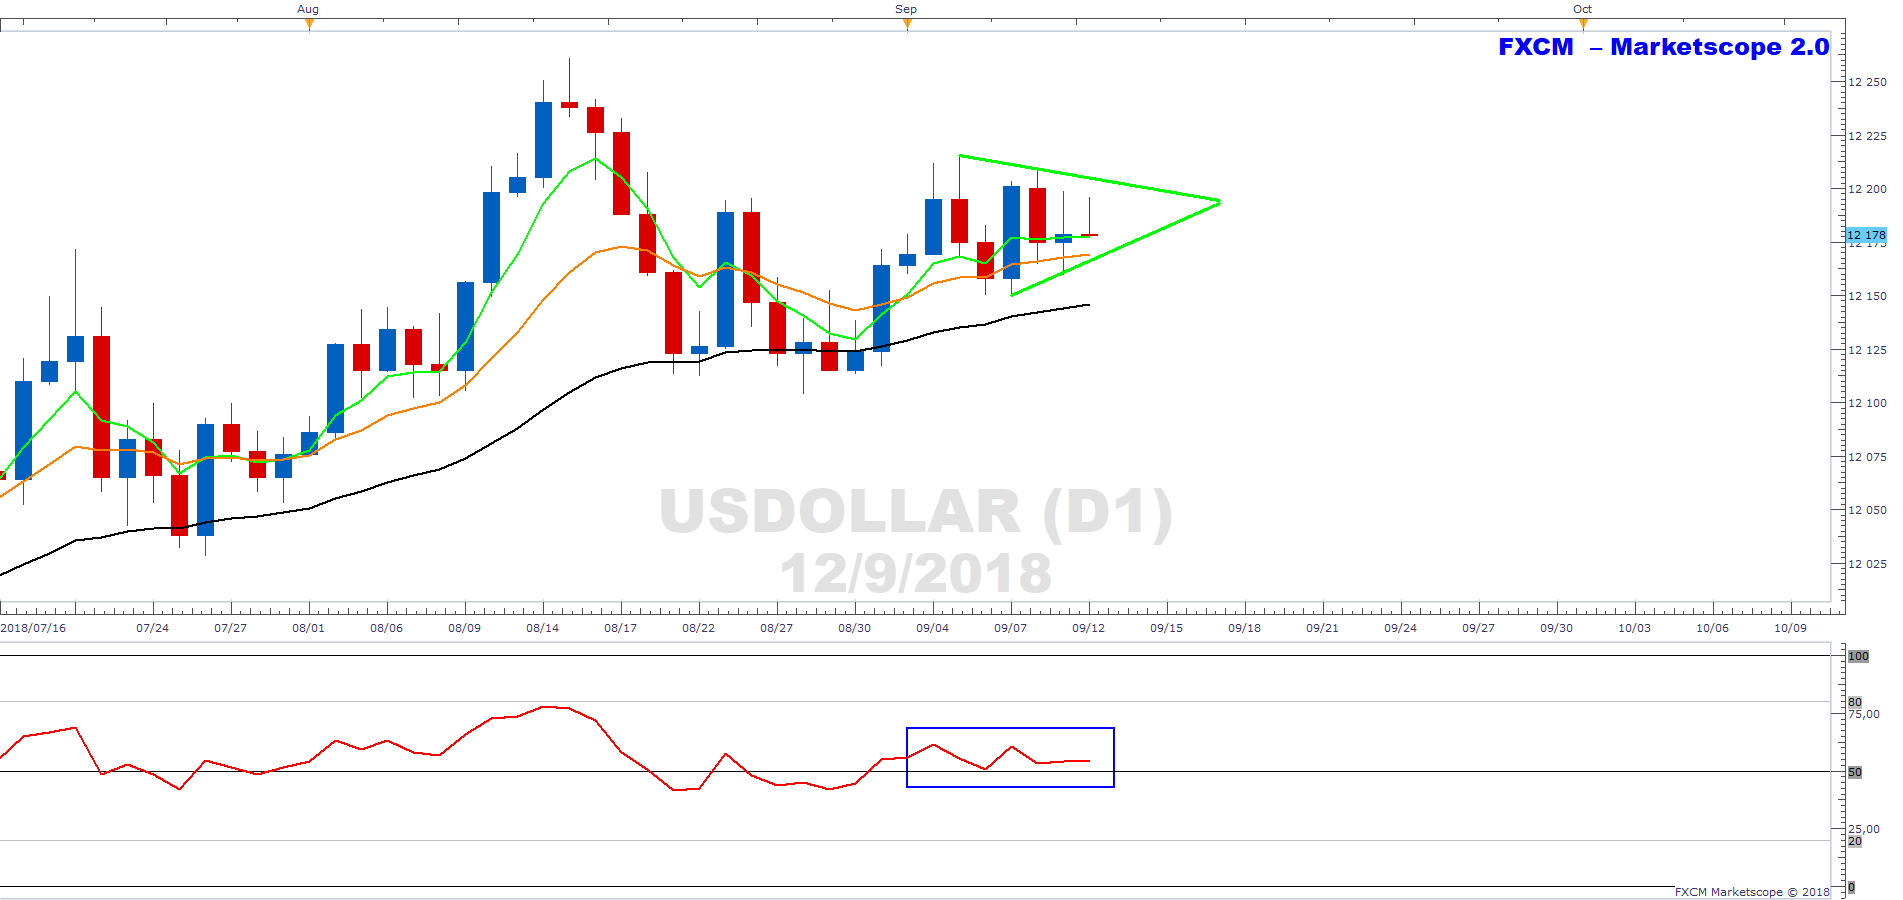
The above shows the USD daily chart. The greenback is consolidating in a small symmetrical triangle (green converging lines). Smaller patterns are usually of the continuation variety. Moreover, the EMAs have formed bullishly with the green 5-day EMA greater than the orange 13-day EMA, and the orange 13-day EMA greater than the black 34-day EMA. The RSI(9) is also over 50 and bullish. Therefore, we are looking for the pattern to potentially resolve with an upside breakout.
Author

Russell Shor (MSTA, CFTe, MFTA) has an Honours Degree in Economics from the University of South Africa and holds the coveted Certified Financial Technician and Master of Financial Technical Analysis qualifications from the Interna
More from Russell Shor, CFTe, MFTA


