USD/CHF Elliott Wave technical analysis [Video]
![USD/CHF Elliott Wave technical analysis [Video]](https://editorial.fxstreet.com/images/Markets/Currencies/Majors/USDCHF/swiss-currency-bank-notes-swiss-francs-25074277_XtraLarge.jpg)
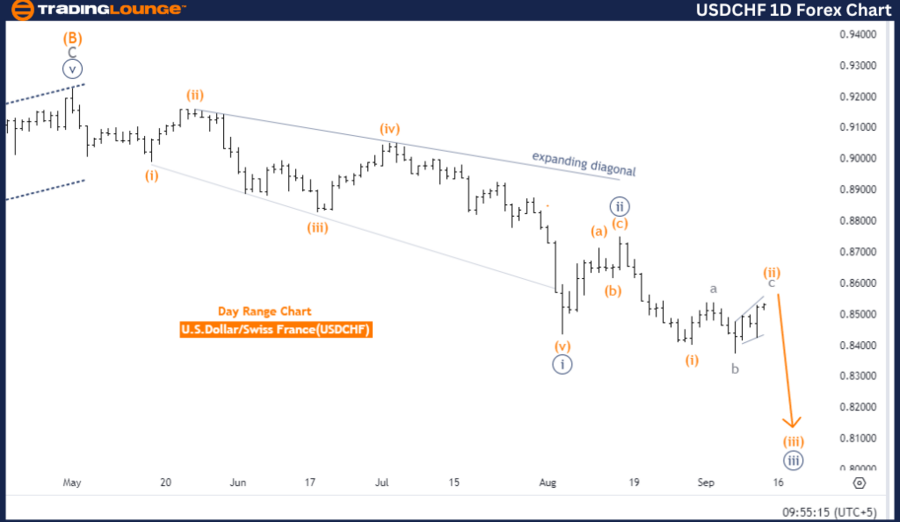
U.S. Dollar / Swiss Franc (USDCHF) – Day Chart
USD/CHF Elliott Wave technical analysis
Function: Counter Trend.
Mode: Corrective.
Structure: Orange Wave 2.
Position: Navy Blue Wave 3.
Next lower degree: Orange Wave 3.
Details: Orange wave 1 is complete, and now orange wave 2 is in progress and nearing its conclusion.
Wave cancel invalid level: 0.87486.
The Elliott Wave analysis for USDCHF on the daily chart shows that the market is in a counter-trend phase, moving in a corrective pattern. Currently, the structure under observation is orange wave 2, with the market positioned in navy blue wave 3. This suggests that the market is in a temporary correction before it resumes a more impulsive movement.
Orange wave 1 has already been completed, and now orange wave 2 is unfolding. This correction appears to be nearing its end, indicating that the market may soon transition into orange wave 3. Once orange wave 2 completes, it is expected that the market will experience a stronger directional move, potentially continuing or reversing the current trend.
The next lower degree wave, orange wave 3, is anticipated to begin following the completion of orange wave 2. Traders are closely watching this transition, as it is expected to shift the market out of its corrective phase and into a more decisive trend. This upcoming phase is critical for determining the future direction of the USDCHF.
A wave cancellation level has been set at 0.87486. If the price drops to or below this level, the current wave count will be invalid, meaning the corrective wave structure will need to be reassessed. As long as the price remains above this invalidation level, the wave count holds, and the market is expected to move from orange wave 2 into orange wave 3.
In summary, the USDCHF is currently in the corrective phase of orange wave 2, which is nearing its end. The next expected move is into orange wave 3, assuming the price does not fall below 0.87486.
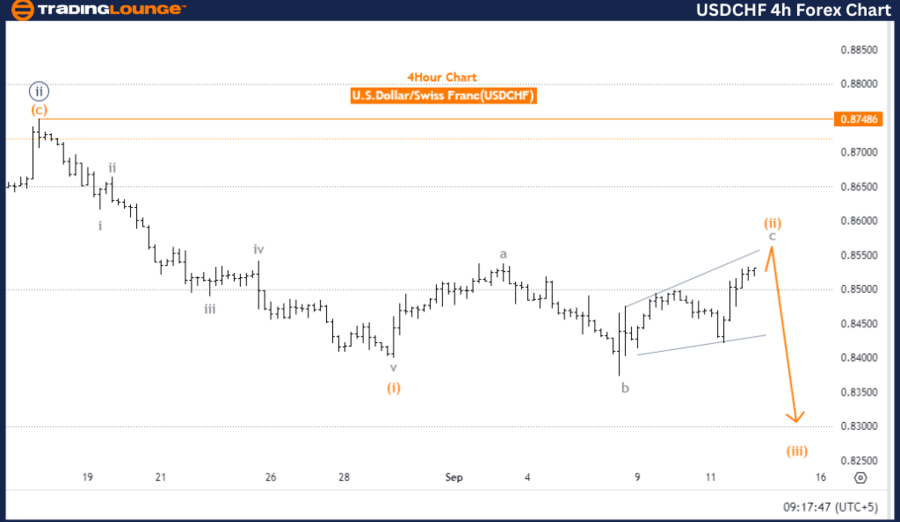
USD/CHF Four-hour chart analysis
Function: Counter Trend.
Mode: Corrective.
Structure: Orange Wave 2.
Position: Navy Blue Wave 3.
Next lower degree: Orange Wave 3.
Details: Orange wave 1 is complete, and orange wave 2 is currently unfolding and nearing its end.
Wave cancel invalid level: 0.87486.
The Elliott Wave analysis for USDCHF on the 4-hour chart indicates the market is moving in a counter-trend phase, operating in a corrective mode. The structure under analysis is orange wave 2, with the market positioned in navy blue wave 3, suggesting a correction within a larger trend. Orange wave 2 remains in progress.
Orange wave 1 appears to have completed, and now orange wave 2 is actively developing. The analysis suggests that orange wave 2 is approaching its conclusion, indicating that the market could soon transition into orange wave 3. This next phase would likely lead to a more impulsive move, resulting in stronger directional momentum once the correction finishes.
The next lower degree involves orange wave 3, which is expected to begin following the completion of orange wave 2. As the correction of orange wave 2 winds down, traders are watching for a potential impulsive wave that could take the market either higher or lower, depending on the emerging trend after the correction.
A wave cancellation level is marked at 0.87486. If the price falls to or below this level, the current wave count becomes invalid, meaning the existing corrective wave structure would need to be reassessed. As long as the price remains above this level, the wave count holds, and the market is expected to move from orange wave 2 into orange wave 3.
In summary, USDCHF is in a corrective phase with orange wave 2 currently unfolding. The market is nearing the end of this correction, preparing to transition into orange wave 3. The analysis remains valid unless the price falls below 0.87486.
USD/CHF Elliott Wave technical analysis [Video]
Author

Peter Mathers
TradingLounge
Peter Mathers started actively trading in 1982. He began his career at Hoei and Shoin, a Japanese futures trading company.


