USD/CHF Elliott Wave technical analysis [Video]
![USD/CHF Elliott Wave technical analysis [Video]](https://editorial.fxstreet.com/images/Markets/Currencies/Majors/USDCHF/computer-keyboard-with-currency-pair-usd-chf-button-49017558_XtraLarge.jpg)
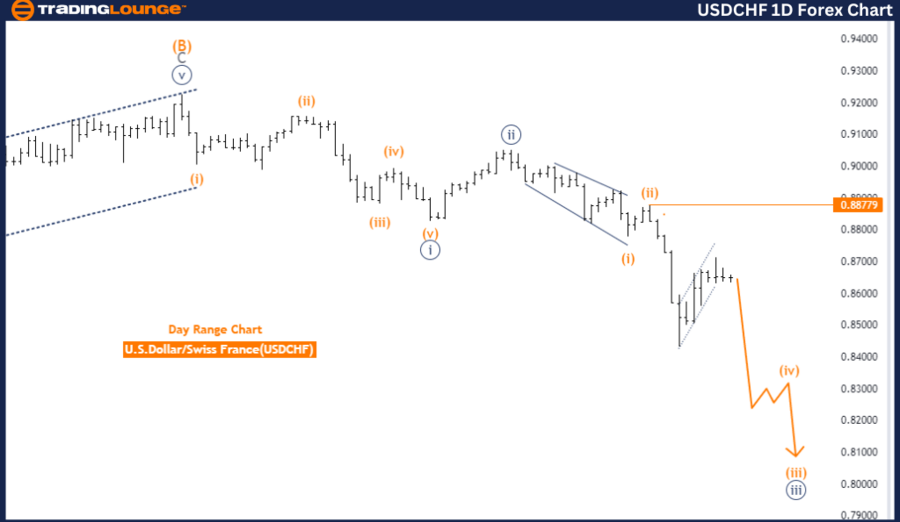
USDCHF Elliott Wave Analysis Trading Lounge Day Chart.
U.S. Dollar/Swiss Franc (USDCHF) Day Chart.
USD/CHF Elliott Wave technical analysis
Function: Trend.
Mode: Impulsive.
Structure: Orange wave 3.
Position: Navy Blue Wave 3.
Direction Next Higher Degrees: Orange wave 4.
Details: Orange wave 2 appears completed; now, orange wave 3 is in play.
Wave cancel invalid level: 0.88779.
The USDCHF Elliott Wave analysis for the daily chart indicates a continuation of the downward trend, marked by an impulsive movement within orange wave 3. This structure suggests a strong bearish momentum in the market. The market is positioned within navy blue wave 3, a critical phase in the Elliott Wave sequence, signaling a significant ongoing downward push.
Before this phase, the market completed orange wave 2, a corrective wave that briefly interrupted the upward trend. With orange wave 2 now complete, the market has entered orange wave 3, which is currently driving the price lower. This transition from wave 2 to wave 3 typically marks a period of renewed market strength, as wave 3 is generally the most powerful and extended wave in an impulsive sequence.
The analysis also indicates that the direction of the next higher degree wave is expected to lead to orange wave 4, which would follow the completion of the current wave 3. However, the primary focus remains on the progression of orange wave 3, which is anticipated to continue pushing the market downward.
A crucial aspect of this analysis is the invalidation level set at 0.88779. This level serves as a key benchmark for confirming the current Elliott Wave count. If the market surpasses this level, it would invalidate the current wave structure, suggesting that the expected downward trend might not continue and could result in a reversal or significant correction.
Summary: The USDCHF daily chart analysis highlights a strong downward trend within orange wave 3, following the completion of orange wave 2. The ongoing navy blue wave 3 supports the bearish momentum, with the invalidation level at 0.88779 being critical for confirming the continuation of the trend.
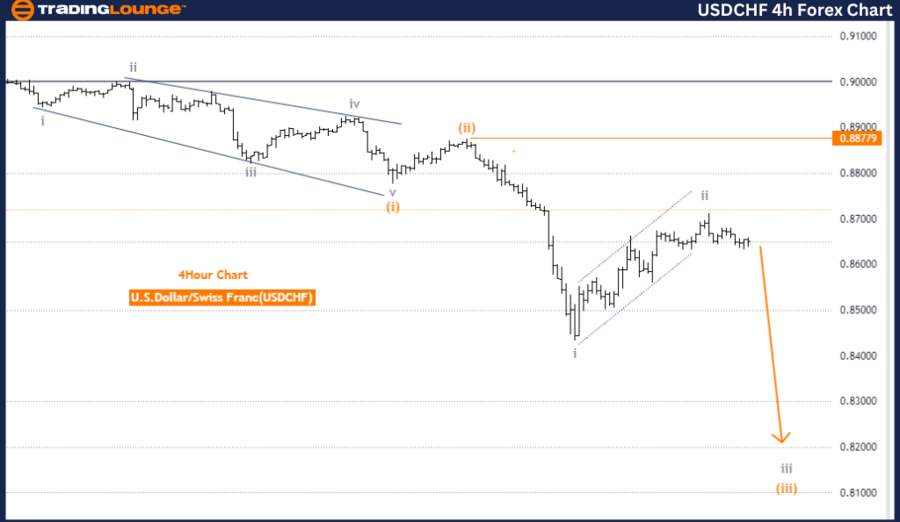
USDCHF Elliott Wave Analysis Trading Lounge 4-Hour Chart.
U.S. Dollar/Swiss Franc (USDCHF) 4-Hour Chart.
USD/CHF Elliott Wave technical analysis
-
Function: Trend.
-
Mode: Impulsive.
-
Structure: Gray wave 3.
-
Position: Orange wave 3.
-
Direction next higher degrees: Gray wave 4.
-
Details: Gray wave 2 appears completed; now, gray wave 3 is in play.
Wave cancel invalid level: 0.88779.
The USDCHF Elliott Wave analysis on the 4-hour chart reveals a strong downtrend, with an impulsive mode indicated by gray wave 3. This suggests a powerful bearish movement in the market. The market is currently positioned within orange wave 3, a critical phase in the Elliott Wave sequence, which typically signals the continuation of the downward trend.
Prior to this phase, gray wave 2, a corrective wave, was completed. With gray wave 2 now out of the way, the market has transitioned into gray wave 3, which is currently driving the price downward. Gray wave 3 is often the strongest and most extended wave in an impulsive sequence, indicating that the current bearish momentum is likely to persist.
The direction of the next higher degree is expected to lead to gray wave 4 following the completion of the current gray wave 3. This suggests that after gray wave 3 runs its course, a corrective wave, gray wave 4, might occur, potentially pausing the downward trend before the final wave in the sequence.
A key aspect of this analysis is the wave cancellation invalid level set at 0.88779. This level is crucial for validating the current Elliott Wave count. If the market price exceeds this level, it would invalidate the current wave structure, implying that the anticipated downward trend might not continue and could instead lead to a reversal or significant correction.
Summary: The USDCHF 4-hour chart analysis indicates a strong downward trend within gray wave 3, following the completion of gray wave 2. The ongoing orange wave 3 reinforces the bearish momentum, with the invalidation level at 0.88779 being critical for confirming the continuation of this trend.
Technical analyst: Malik Awais.
USD/CHF Elliott Wave technical analysis [Video]
Author

Peter Mathers
TradingLounge
Peter Mathers started actively trading in 1982. He began his career at Hoei and Shoin, a Japanese futures trading company.


