USD/CHF Elliott Wave analysis shows fresh sell-off from bluebox

. Welcome to a new blog post where we discuss recent trade setups from the blue box to the Elliottwave-forecast members. In this one, the spotlight will be on the USDCHF currency pair.
The USDCHF currency pair remains clearly bearish. This trend is driven by dollar weakness since September 2022 and more recently January 2025. When analyzing this pair, we focus heavily on the dollar. The dollar has been in a bearish cycle since September 2022. It follows a clear A-B-C corrective structure. Wave C of this 3-swing pullback began in January 2025.
Since it is a simple zigzag, wave C has unfolded as an impulse. However, the September 2022 cycle has not yet reached its target zone. Moreover, all bounces so far have been corrective. Therefore, we continue to favor a “sell the bounce” strategy. This approach has delivered strong profits across dollar pairs, including USDCHF.
For USDCHF specifically, the bearish cycles began in October 2022 and January 2025. Since January, we have sold bounces at the extremes of 3, 7, or 11 swings. We highlight these extreme zones with blue boxes on our charts. For example, there was a clean 7-swing corrective bounce from July 1, 2025. When that bounce matured, we marked the blue box zone for selling. This setup was shared with members on August 9, 2025. From the August blue box, USDCHF fell over 330 pips. We wrote about it; read here. It even broke below the July low where the bounce started. As a result, we prepared for another corrective bounce to sell from.
USD/CHF Elliott Wave setup: 9.21.2025 update
Shortly after the 17th September FOMC, the pair breached the July 1st low and then turned upside to correct August cycle. Thus, we prepared to sell from the blue box. We shared the H1 chart below with members on the 21st September 2025.
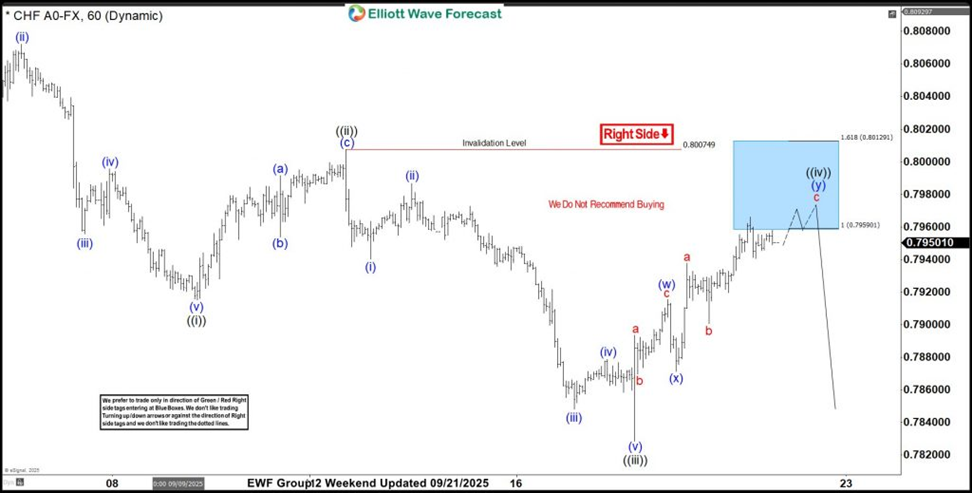
The chart above highlighted the 0.7959-0.8012 blue box zone for short opportunities. From the blue box, we expected wave ((v)) to start and continue lower to break the current September low. Alternatively, if not an impulse, then at least a 3-swing dip to happen. A 3-swing dip will put sellers in risk-free position. The chart shows price already triggered the blue box. Thus members are in an open short position.
USD/CHF Elliott Wave setup: 9.22.2025 update
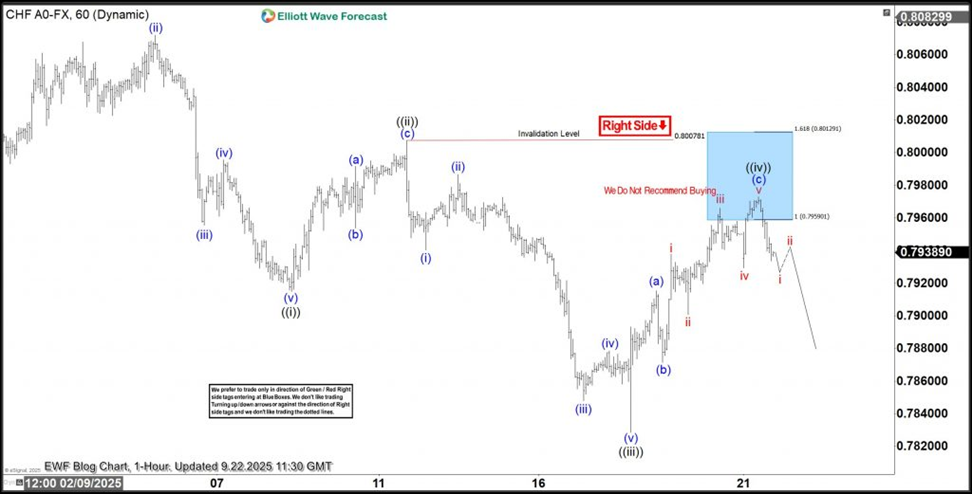
The chart above shows the H1 price action leaving the blue box after it triggered it. Price separation is ongoing and we expect it to extend to at least the 50% of wave (c) of ((iv)), where they can take the first profit and run a risk-free trade. This is another typical example of our blue box entry system we use for all the 78 market we cover across all the time frames.
Author

Elliott Wave Forecast Team
ElliottWave-Forecast.com


