USD/CAD’s trade range is turning gloomy
-
USD/CAD meets a make-or-break point after a weekly decline.
-
Technical picture favors the bears, but confirmation needed below 1.3730.

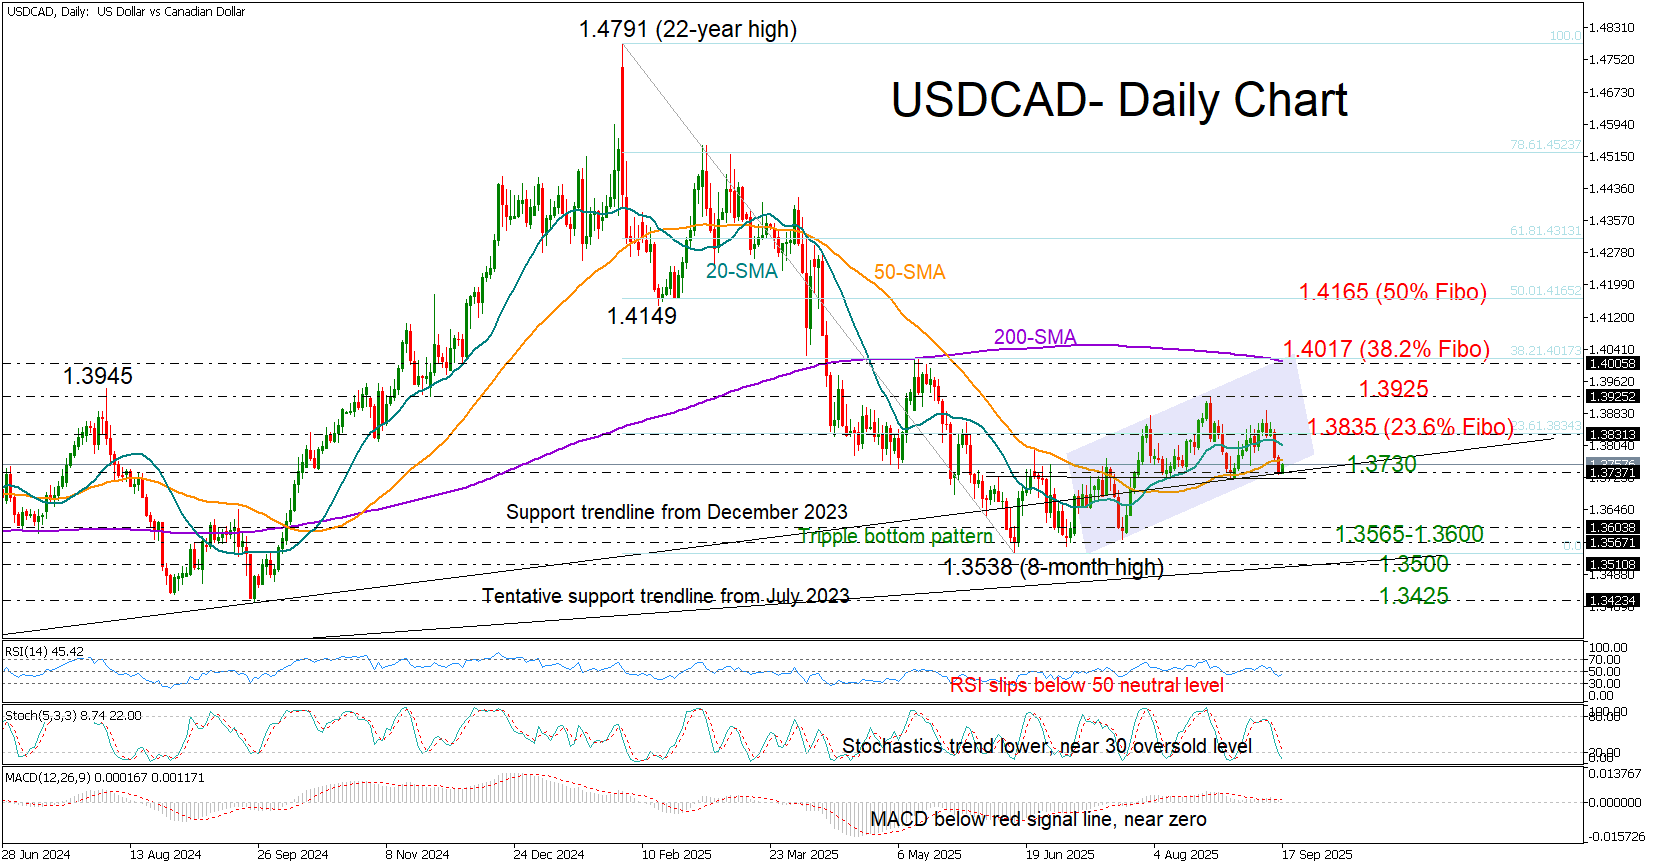
USD/CAD will take cues from the Bank of Canada and FOMC policy decisions later today, as sellers aim to dissolve the two-month sideways trajectory on the downside. What began as a promising triple-bottom pattern in July has shifted into a bearish head-and-shoulders setup, but confirmation requires a decisive move beneath the neckline of 1.3730.
Both central banks are expected to cut rates, though the BoC confronts clearer signs of slowing demand. Canada’s unemployment rate has reached a three-year high, inflation is easing, and Q2 GDP slipped into contraction. If the BoC signals a steeper path of easing than the Fed, the pair may find near-term support.
Yet, the technical signals are somewhat discouraging. The RSI has dropped below 50, the Stochastic is nearing oversold territory, and a cross under the 50-day simple moving average (SMA) has clouded the outlook further.
Should selling pressures intensify, the price could sink towards the 1.3565–1.3600 region, with the 2023 trendline offering additional support near 1.3510. A deeper drop could expose the September 2024 low of 1.3430.
On the upside, the bulls need to crawl above 1.3835 – the 23.6% Fibonacci retracement of the January–June slide – to retest the August high at 1.3925. A sustained move higher could then meet resistance at the 200-day SMA and the 1.4000 zone, where the 38.2% Fibonacci level lies.
Overall, the short-term bias remains tilted to the downside, with a close below 1.3730 sealing the bearish case.
Author

Christina joined the XM investment research department in May 2017. She holds a master degree in Economics and Business from the Erasmus University Rotterdam with a specialization in International economics.


